4507-second window · 3 observations · Measured Nov 3, 2026, 2:33 PM UTC · Provider: go_recent_snapshot_v2
"I Voted" Sticker Searches Spike on Election Day 2026
Voting talk hit a measured 2,292.5 posts/hour on Nov 3, 2026, with 6,000 posts in the snapshot. Here's what the "I voted" sticker surge means.
Automated briefing. Generated from stored signal measurements and source-backed research; it is not manually reviewed. Read the methodology and limitations or the editorial standards.
Metrics in this briefing are a snapshot associated with its publication date and may not reflect current conditions.
What changed
Discussion of "voted" accelerated sharply in the snapshot observed at 2026-11-03T14:33:21Z. The stored signal shows a snapshot volume of 6,000 posts and a measured snapshot rate of 2,292.5 posts per hour over a 4,507-second measurement window built from 3 stored observations. In plain terms: at the moment of measurement, voting talk was moving fast — but the stored data does not establish why, and it does not identify which meaning of "voted" is driving it. Search demand is concentrated on a practical question, "where did the 'I voted' sticker come from," alongside Election Day tasks like finding a polling place and confirming a ballot was counted.
| Observation time | Measured snapshot rate | Snapshot volume |
|---|---|---|
| 2026-11-03T14:33:21Z | 2,292.5 posts/hour | 6,000 posts |
Why this topic may be moving
The one thing the stored signal supports is timing: the spike lands on November 3, 2026, the date searchers are associating with midterm elections. That is a plausible anchor, not a proven cause. The brief does not verify that a single event beyond the elections produced the 2,292.5 posts/hour rate, and it does not confirm whether the trending label refers to U.S. elections, crypto governance voting, or another use of the word.
Search intent points in several directions at once. Some searchers want the history of the "I voted" sticker; some want to post one; some want to verify their ballot; some may mean dYdX governance voting, which dYdX Documentation covers. Ballon d'Or and other unrelated meanings also appear in results. A spike in a word with many meanings should be read as a bundle of behaviors, not a single story.
The strongest conclusion the stored signal supports is velocity, not cause: voting talk was moving quickly at the observation time, and the editorial job is to separate measurable speed from unverified explanation.
Why it matters
For readers, the practical stakes are Election Day tasks: finding a polling place, understanding the sticker, and confirming a vote was counted. For newsrooms and analysts, the lesson is that a high-volume label like "voted" can mix civic participation, social posting, and technical governance talk in one stream. Treating the label as a single trend risks misreading the audience.
Who should care most: voters looking for verified procedures, social teams watching Election Day conversation, and anyone tracking governance voting in crypto, where dYdX Documentation is a verified reference for its own voting process.
What to watch next
- Whether the measured rate persists, rises, or fades in the next stored observation — a sustained rate is stronger evidence than a single snapshot.
- Whether search intent shifts from sticker history to ballot verification as the day progresses.
- Whether non-election meanings of "voted" grow or shrink relative to the Election Day cluster.
- Whether official election sources publish polling-place and ballot-status guidance that answers the most practical queries.
Frequently asked questions
Why is "voted" trending right now?
The stored snapshot at 2026-11-03T14:33:21Z shows a measured rate of 2,292.5 posts/hour and a volume of 6,000 posts. The timing coincides with November 3, 2026, but the brief does not verify a specific cause beyond general Election Day timing.
Where does the "I voted" sticker come from and who made the first one?
The verified brief does not establish who created the first "I voted" sticker or its exact origin date, so that claim cannot be confirmed here. Searchers looking for sticker history should treat duplicated wire-style features cautiously until a primary source is cited.
Why do people post "I voted" on social media?
The brief does not verify a single motive. What is measurable is that voting-related posting was moving at 2,292.5 posts/hour at the observation time, consistent with a visible social ritual around Election Day.
How can I check whether my vote was counted?
The brief does not verify vote-verification procedures, so no method is asserted here. Readers should use official election-authority guidance for their jurisdiction rather than social posts.
What elections are happening on November 3, 2026?
The brief references the November 3, 2026 midterm elections as a related search and timing anchor, but it does not verify a full list of contests. Confirm specifics with official election sources.
What do the different "I voted" sticker designs mean?
The brief does not verify design meanings. Sticker variation is a visual and local tradition, but no specific design interpretation is confirmed here.
Methodology and limitations
The measured figure is a snapshot rate: 2,292.5 posts/hour over an exact 4,507-second window using 3 stored observations, captured at 2026-11-03T14:33:21Z. It is not a live or current rate, a forecast, reach, engagement, or a unique-person count. The canonical category is Politics, and the stored signal description is empty. The search-intent brief is treated as untrusted contextual data; factual attribution is limited to dYdX Documentation for dYdX governance voting. The small number of observations limits confidence in persistence.
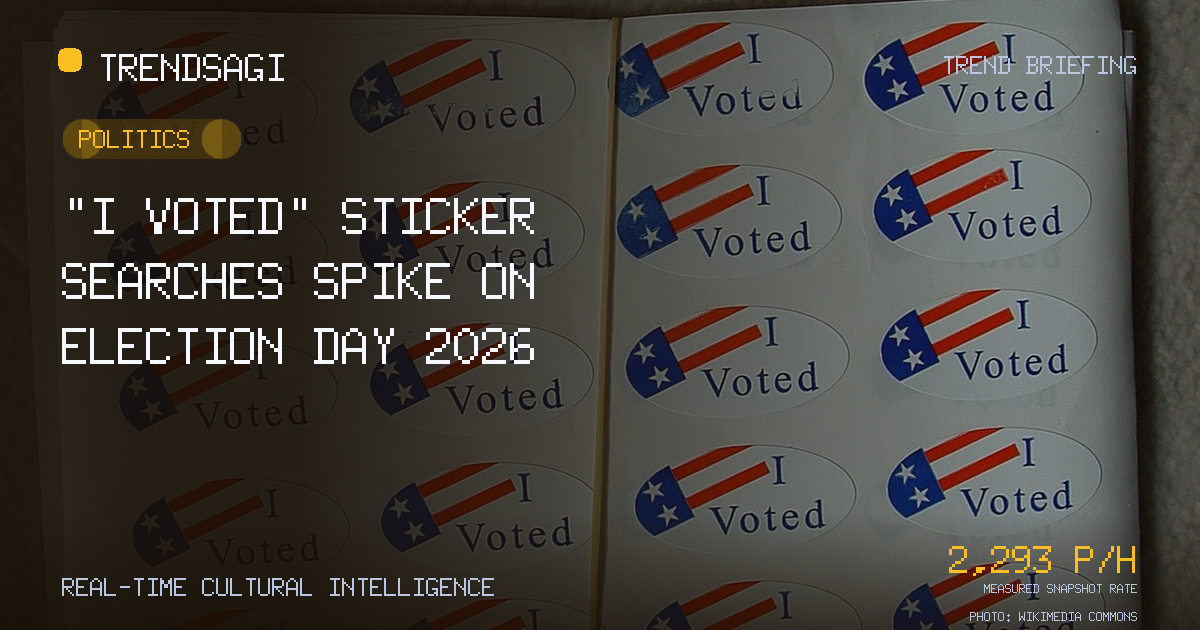
Image: I Voted sticker by Joe Hall, CC BY 2.0, via Wikimedia Commons.
Track This Topic for New Signals
Set alerts for future velocity or sentiment changes around this topic.
Explore Tracking PlansAbout TrendsAGI research
TrendsAGI's automated research pipeline publishes dated signal snapshots, methodology notes, and practical workflows for teams evaluating cultural momentum. Read how signals are scoped, scored, and limited in our research methodology.