322-second window · 3 observations · Measured Oct 10, 2026, 12:57 PM UTC · Provider: go_recent_snapshot_v2
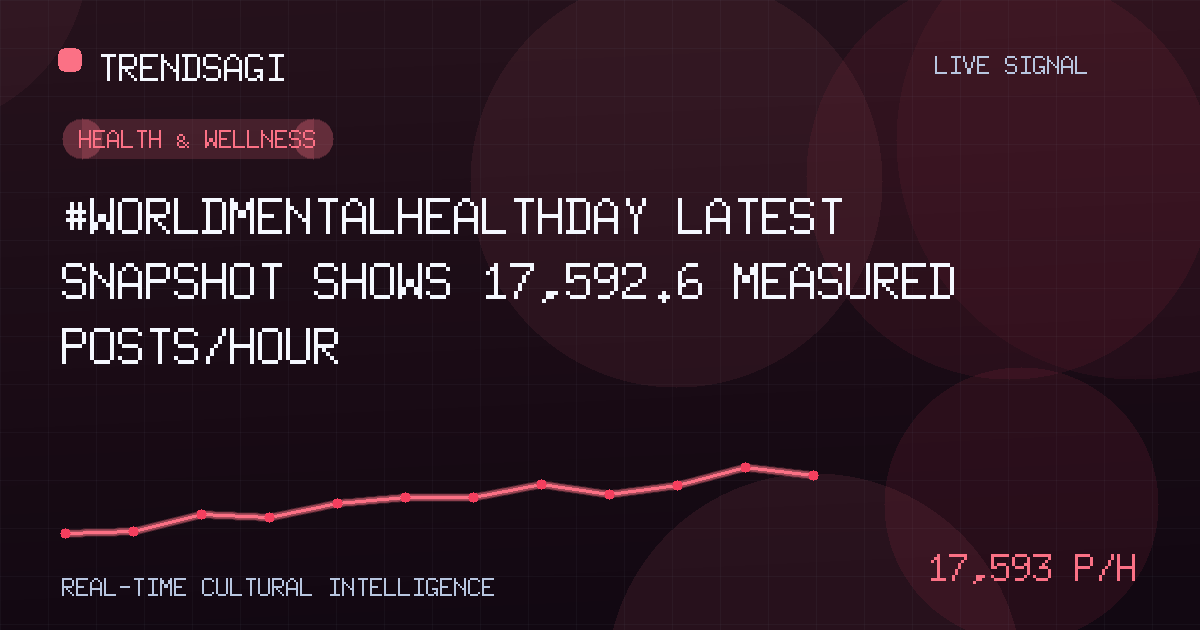
#WorldMentalHealthDay latest snapshot shows 17,592.6 measured posts/hour
#WorldMentalHealthDay recorded 17,592.6 measured posts/hour in a 322-second window; the cause is unverified, and volume is not population need.
Automated briefing. Generated from stored signal measurements and source-backed research; it is not manually reviewed. Read the methodology and limitations.
Metrics in this briefing are a snapshot associated with its publication date and may not reflect current conditions.
What changed
#WorldMentalHealthDay produced a concentrated burst of tagged conversation in the latest snapshot. The snapshot contained 1,800 posts, and its associated measured snapshot rate was 17,592.6 posts/hour. The direct conclusion is deliberately narrow: the hashtag attracted substantial posting activity in the measured interval, but the available record does not establish what triggered that activity.
The measured change was 17,592.6 posts/hour over an exact 322-second window using 3 stored observations at 2026-10-10T12:57:10Z. This is a measured snapshot rate, not a live or current rate, forecast, reach estimate, engagement count, or unique-person count. The 1,800 figure is the separate latest snapshot volume; it should not be converted into or described as a rate.
| Observation time | Measured snapshot rate | Latest snapshot volume |
|---|---|---|
| 2026-10-10T12:57:10Z | 17,592.6 posts/hour | 1,800 posts |
The rate shows pace during a very short window, while snapshot volume shows how many posts were present at the captured observation. Neither establishes how long the activity will last.
Why this topic may be moving
No verified public context in the record identifies a specific catalyst behind the movement. The timestamped observation and the topic label are not, by themselves, evidence that a scheduled observance, news event, campaign, celebrity post, policy announcement, or platform change caused the spike. Each is a hypothesis that would require dated corroboration.
That distinction matters because the same volume pattern can arise from different behavior. A broad group may be posting original reflections; a campaign may be driving highly similar reposts; media coverage may be recirculated; or automated accounts may contribute repetitive material. None of those possibilities is established here. Until a dated primary announcement or independently reported event is matched against the observation timeline, the cause remains unclear.
Useful verification would start with primary material from an identifiable organizer and then test it against reputable public reporting. Publication time alone would not prove causation; it would still be necessary to examine whether the post volume changes around that time, whether posts reference the claimed trigger, and whether independent account groups participate.
Why it matters
A rapid rise in tagged posts measures attention, not the prevalence of mental illness, the number of people needing care, or the severity of distress in a community.
For mental-health services, nonprofits, community moderators, and crisis teams, the signal may justify a rapid review of incoming questions and support needs. It does not justify estimating service demand from post counts alone. Repeated questions about access, treatment, emergency help, or caregiving can reveal information gaps, but individual posts should not be treated as clinical evidence or proof that a local service is overwhelmed.
For editors and communicators, the central risk is framing. Reporting “1,800 posts” or “17,592.6 posts/hour” without the measurement window can make a momentary spike sound like a sustained trend or a population statistic. Stronger coverage would say that the rate was measured over an exact 322-second window from 3 observations, distinguish volume from pace, and state that no causal explanation has been verified.
For researchers, policymakers, and platform teams, the next question is composition rather than size. Who posted, where and in which language, whether the posts were original or duplicated, what intentions they expressed, and whether activity was concentrated among a small set of accounts all affect interpretation. Those details are absent, so the present signal can guide monitoring but cannot support conclusions about beliefs, behavior, or need.
What to watch next
- Persistence: Collect more timestamped observations under the same query and collection method. A further elevated interval would support sustained attention; a quick return to the prior level would point to a brief event. The current record does not supply the prior level needed for that comparison.
- Originality and duplication: Separate original posts from reposts, quotes, copied text, media attachments, and automated-looking traffic. Rising originality would suggest broader participation; repeated identical content would weaken that interpretation.
- Concentration: Check whether a small set of accounts, domains, locations, or languages dominates the sample. A narrow distribution can reflect a campaign or coordinated amplification rather than a broad societal conversation.
- A verified catalyst: Look for a dated primary announcement and independent reporting that can be matched to the raw timeline. Then test whether posts explicitly reference the event. Do not infer causation from temporal coincidence alone.
- Topic mix: Code a stratified sample for first-person experience, help-seeking, advocacy, information sharing, celebration, fundraising, news commentary, and harmful or misleading claims. These categories have different implications and should not be merged into a single sentiment score.
- Independent corroboration: Compare the social signal with search interest, related hashtags, publication volume, and—where lawfully and ethically available—aggregate service demand. Independent movement across measures would make the event more credible; divergence should remain visible rather than being smoothed into one story.
Concrete warning signs would include a second high-rate interval without a verified trigger, sharp concentration in repetitive accounts, sudden growth in dangerous health advice, or an increase in urgent help-seeking language. Concrete reassurance would include sustained participation from diverse original posters, coherent references to a dated catalyst, and stable or improving service capacity. None of those conditions is established by the current snapshot.
Methodology and limitations
The signal is categorized as Health & Wellness. It was observed at 2026-10-10T12:57:10Z and contained 1,800 posts. The reported rate of 17,592.6 posts/hour was measured over an exact 322-second window using 3 stored observations. Because those observations cover only a very short interval, the result is sensitive to any momentary cluster and does not show how long the pattern persisted.
No comparison baseline, sampling frame, collection API, query details, deduplication method, geographic coverage, language coverage, account verification, sentiment analysis, or engagement data accompanies the signal. The figures therefore cannot establish unique participants, human versus automated posting, organic reach, public sentiment, changes in mental-health prevalence, or demand for services. They also do not show whether the same accounts appeared across snapshots.
The safest reading is a high-volume attention event captured in a short measurement window, with no verified cause. Before acting on it as a trend, confirm persistence, inspect the composition of the posts, seek a dated public explanation, and connect the signal to relevant operational data. That process would turn a fast-moving alert into evidence that can support a decision.
Track This Topic for New Signals
Set alerts for future velocity or sentiment changes around this topic.
Explore Tracking PlansAbout TrendsAGI research
TrendsAGI's automated research pipeline publishes dated signal snapshots, methodology notes, and practical workflows for teams evaluating cultural momentum. Read how signals are scoped, scored, and limited in our research methodology.


