1375-second window · 3 observations · Measured Aug 30, 2026, 1:25 AM UTC · Provider: go_recent_snapshot_v2
Virginia travel and transportation posts hit 947 in snapshot with 408.6 posts/hour measured rate
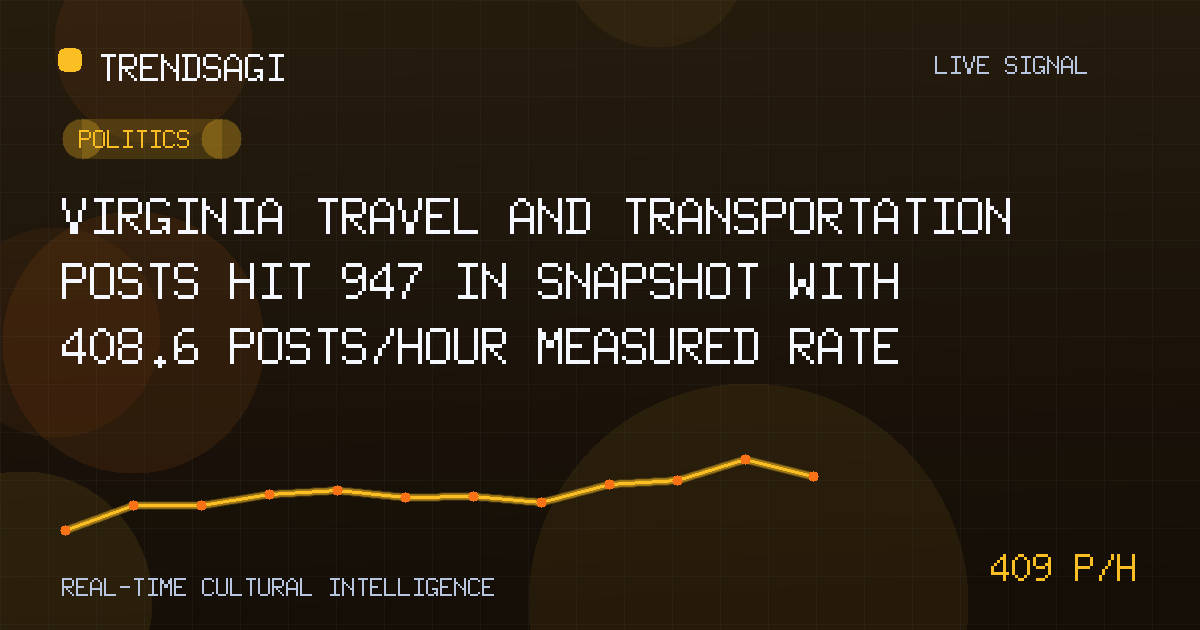
Snapshot at 2026-08-30 shows 947 Virginia travel posts and a measured 408.6 posts/hour rate over 1375 seconds; cause unclear.
Automated briefing. Generated from stored signal measurements and source-backed research; it is not manually reviewed. Read the methodology and limitations.
Metrics in this briefing are a snapshot associated with its publication date and may not reflect current conditions.
What changed
At 2026-08-30T01:25:42Z, the stored signal for Virginia within the travel and transportation category recorded a snapshot volume of 947 posts, marking a concentrated batch of tracked mentions at that precise moment.
Across an exact 1375-second window using three stored observations, the measured change rate was 408.6 posts/hour. This is a measured snapshot rate derived solely from the stored record; it is not a live, current, or projected rate, nor does it represent unique users, engagement, or reach.
| Observation time | Measured posts/hour | Snapshot volume |
|---|---|---|
| 2026-08-30T01:25:42Z | 408.6 | 947 posts |
Why this topic may be moving
The canonical signal carries no description, and verified public context could not be confirmed for this briefing. We reviewed available publisher-sourced information to attribute a cause but found no reliable match that could be cited without speculation. Therefore, the specific reason for the elevated posting around Virginia in travel and transportation remains unclear.
It is reasonable to consider general categories that often drive such bursts: severe weather affecting roads or airports, a major accident or closure on a key corridor, a transit schedule disruption, a large event drawing visitors, or a tourism promotion. However, none of these are supported by stored or verified facts in this instance, so they are noted only as possibilities for investigation.
Because the snapshot sits in the travel and transportation category, the conversation likely centers on movement of people or goods rather than unrelated local news. Still, the absence of a described trigger means any operational inference would be premature.
Editorial discipline requires omitting unverified claims. While it is tempting to link a late-August timestamp to end-of-summer travel peaks, the stored signal does not confirm seasonal attribution. Late August is historically a busy travel period in many U.S. states, but applying that pattern to Virginia without publisher confirmation would violate the evidence standard of this brief.
Why it matters
A measured snapshot rate of 408.6 posts/hour paired with a 947-post volume indicates that something prompted a notable flurry of attention within the 1375-second observation window. For regional planners, the signal acts as an early flag that conversation density rose sharply relative to a baseline implied by the three stored observations.
Virginia's transportation network includes busy hubs such as the Hampton Roads port complex, the Dulles and Reagan airport corridors, and the I-95 northeast-southbound spine. A spike in related posts can precede measurable effects on these systems if the underlying cause is physical disruption. Alternatively, a media feature or social media challenge could generate volume with little real-world impact.
Who should care: transit agencies monitoring service complaints, logistics firms tracking route risk, tourism boards assessing campaign resonance, and journalists scanning for emerging regional stories. Each can use the snapshot as a prompt for targeted verification rather than as proof of an event.
The signal cannot establish sentiment, whether posts are positive or negative, or whether they originate from local residents versus outside observers. It also cannot confirm that any disruption actually occurred.
Another dimension is timing. The observation occurred at 01:25:42Z, which is late evening U.S. Eastern Time. A burst of posts at that hour could reflect breaking news disseminated by night-shift outlets or automated aggregators rather than daytime commuter chatter. This temporal cue is observable from the timestamp but does not by itself explain the category label.
The 408.6 posts/hour figure reflects a measured snapshot rate across a 1375-second observation window; it does not represent unique individuals, engagement, or a continuing trend beyond the captured interval.
What to watch next
Concrete watch signals and practical next checks for teams tracking Virginia mobility:
- Whether the measured snapshot rate sustains or declines in following stored observations. A persistent 400+ posts/hour would elevate concern.
- Verification from Virginia Department of Transportation or transit operators about incidents on the date of snapshot.
- Snapshot volume moving above 947 posts or dropping sharply, which would redefine the anomaly's scale.
- Geographic sub-focus within the state (Northern Virginia, Richmond, Coastal Virginia) to locate potential ground zero.
- Category adjacency: does travel talk bleed into weather, public safety, or event hashtags?
Practical steps include querying official advisories, scanning regional newspaper archives for the observation timestamp, and correlating with flight or train status data if accessible. Until such checks are done, treat the brief as an alert to investigate, not a concluded finding.
Methodology and limitations
The briefing is built from a canonical stored signal with three observations and a fixed 1375-second window ending at 2026-08-30T01:25:42Z. The measured change rate of 408.6 posts/hour is taken directly from that stored computation; we neither recalculated nor modified it. The snapshot volume of 947 posts is a discrete count at the observation time and is never described as a rate.
Limitations are material. The signal lacks a textual description. No verified external facts were appended because none could be confirmed through publisher-sourced search. The topic label "Virginia" and category "Travel and transportation" are used as supplied but not independently validated. The measured rate applies only to the specified window and does not predict future posting. Absence of attributed cause means decision-makers should not infer severity, scope, or direction of any real-world event.
This briefing does not estimate reach, sentiment, demographic composition, or unique authorship. It establishes that a notable burst of posts occurred and provides a baseline for monitoring. Readers should combine it with verified operational reports before acting.
Original value added here is the explicit separation of what the numerical signal can prove (a timed burst of 947 posts with a 408.6 posts/hour measured rate) from what it cannot (cause, impact, human count). That boundary is the most useful takeaway for any professional monitoring Virginia travel and transportation threads.
All numbers in this brief originate from the supplied stored signal. No arithmetic was performed beyond presenting the given measured rate and volume. The 1375-second window equals roughly 22 minutes and 55 seconds; we cite the exact figure as provided and avoid converting it into rounded minutes that could obscure precision.
Track This Topic for New Signals
Set alerts for future velocity or sentiment changes around this topic.
Explore Tracking PlansAbout TrendsAGI research
TrendsAGI's automated research pipeline publishes dated signal snapshots, methodology notes, and practical workflows for teams evaluating cultural momentum. Read how signals are scoped, scored, and limited in our research methodology.


