1419-second window · 3 observations · Measured Aug 27, 2026, 3:57 AM UTC · Provider: go_recent_snapshot_v2
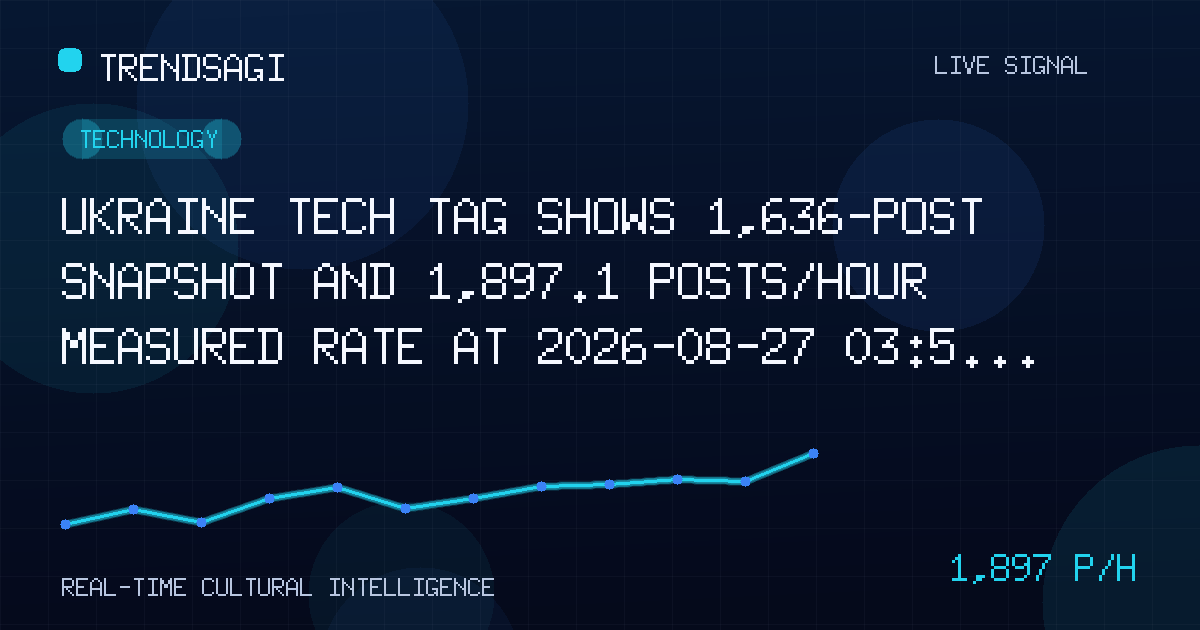
Ukraine tech tag shows 1,636-post snapshot and 1,897.1 posts/hour measured rate at 2026-08-27 03:57 UTC
At 2026-08-27T03:57:02Z, Ukraine tech posts showed 1,636 snapshot volume and 1,897.1 posts/hour measured rate; brief explains limits and next checks.
Automated briefing. Generated from stored signal measurements and source-backed research; it is not manually reviewed. Read the methodology and limitations.
Metrics in this briefing are a snapshot associated with its publication date and may not reflect current conditions.
What changed
At 03:57:02 UTC on 27 August 2026, the technology-category discussion cluster tagged with the label Ukraine registered a snapshot volume of 1,636 posts. The measured snapshot rate derived from three stored observations across an exact 1,419-second window anchored to that timestamp was 1,897.1 posts per hour. This is a discrete, backward-looking measurement of posting density, not a live stream or a projection.
The rate implies that, within the roughly 23.65-minute observation window ending at the snapshot, the accumulated posting activity averaged near 1,897 posts each hour if the pace had held. The snapshot volume of 1,636 posts is simply the count captured at the final observation and should not be described as a rate or as representative of unique authors.
| Observation time (UTC) | Measured posts/hour | Snapshot volume (posts) |
|---|---|---|
| 2026-08-27T03:57:02Z | 1897.1 | 1636 |
Why this topic may be moving
The canonical stored signal carries no description of the underlying event, and we were unable to verify a specific public cause through available search. No publisher-attributed fact could be confirmed to explain why technology-labeled Ukraine posts accelerated at this moment. In line with editorial standards, the cause is stated plainly as unclear.
Volume spikes in a geographic label combined with a technology category can stem from many developments: cybersecurity incidents, drone or satellite procurement news, energy infrastructure repairs, open-source intelligence releases, or shifts in semiconductor export controls. None of these are confirmed here. Treating unverified speculation as fact would violate the separation between raw signal and explained narrative.
Researchers should avoid inferring direction from volume alone. A rising count does not indicate support, opposition, or operational impact. It marks attention, not substance.
A measured snapshot rate tells you how fast a conversation was moving at a fixed point; it does not tell you why, by whom, or with what accuracy.
Why it matters
The signal is useful to teams that monitor early indicators of technology-related attention around Ukraine. Specific audiences include defense innovation analysts, cyber threat intelligence groups, reconstruction and infrastructure investors, academic observers of wartime technology transfer, and newsroom trend desks. For these readers, an abrupt measured rate above the baseline stored observations is a prompt to allocate verification resources, not a conclusion.
What the signal can establish: a quantified jump in posting volume within a defined window, anchored to a timestamp and a category. It provides a reproducible numeric anchor for later comparison against subsequent snapshots.
What the signal cannot establish: the sentiment of the posts, the proportion of original reporting versus reposts, the language distribution, the geographic origin of posters, the authenticity of accounts, or the real-world event linkage. It also cannot distinguish between a coordinated campaign and organic professional discussion.
Because the category is Technology, the cluster likely excludes pure military or political threads unless they were tagged through the same label. This scoping limits general conclusions about overall Ukraine discourse.
For an editorial desk, the value lies in triage. A measured snapshot rate of this magnitude compresses the time available to verify before broader narratives form. Allocating a single analyst to sample the captured posts within an hour of such a signal is a proportionate response.
What to watch next
Practical next checks for a reader who sees this briefing:
- Retrieve the next stored snapshot for the same label and category to see whether the measured rate decays toward baseline or persists above 1,500 posts per hour.
- Sample a random subset of the 1,636 captured posts to identify dominant subthemes (e.g., software, hardware, connectivity) and verify with primary sources.
- Cross-reference with independent trend aggregators and publisher feeds to confirm whether a named technology event occurred near 27 August 2026.
- Check whether the posting accounts show prior history in technology discussion or are newly created, which would change interpretation.
- Monitor for category migration, where the label shifts from Technology to Politics or Conflict in later snapshots.
Concrete watch signals that would raise confidence in a genuine technology-development story include sustained measured rates above 1,800 posts per hour for three consecutive snapshots, appearance of identifiable product or policy names in sampled posts, and attribution by a recognized technology publisher within 24 hours of the snapshot.
Conversely, if the next snapshot shows volume below 500 posts and no verified event, the spike should be treated as transient noise or scheduled content drops rather than a trend.
Methodology and limitations
The measured change rate of 1,897.1 posts per hour was calculated from three stored observations spanning exactly 1,419 seconds, with the final observation at 2026-08-27T03:57:02Z. The arithmetic converts the observed post counts in that window to an hourly equivalent. The snapshot volume of 1,636 posts is the count at the final observation and is reported separately to avoid conflating a count with a rate.
All supplied values are treated as unverified inputs. No external page was used to alter the numbers. The absence of a stored signal description means the brief does not assign causal weight. The measurement window of 1,419 seconds is approximately 23.65 minutes; extrapolation beyond that window is not supported by the data.
Limitations include potential duplication from cross-posting, unknown filtering rules that defined the Technology category, and lack of demographic or linguistic breakdown. The rate is not adjusted for unique authors, so a small number of high-frequency accounts could distort the apparent activity. The brief deliberately omits any live or forecast claim because the inputs are point-in-time.
The three stored observations are not individually published here; only the derived window and rate are supplied. This prevents over-interpretation of intermediate counts.
For ongoing monitoring, the most reliable practice is to compare future measured snapshot rates against this baseline while layering source verification. Until a publisher-attributed event is confirmed, the brief remains an alert about attention velocity, not an explained trend.
Track This Topic for New Signals
Set alerts for future velocity or sentiment changes around this topic.
Explore Tracking PlansAbout TrendsAGI research
TrendsAGI's automated research pipeline publishes dated signal snapshots, methodology notes, and practical workflows for teams evaluating cultural momentum. Read how signals are scoped, scored, and limited in our research methodology.


