980-second window · 2 observations · Measured Oct 9, 2026, 11:54 AM UTC · Provider: go_recent_snapshot_v2
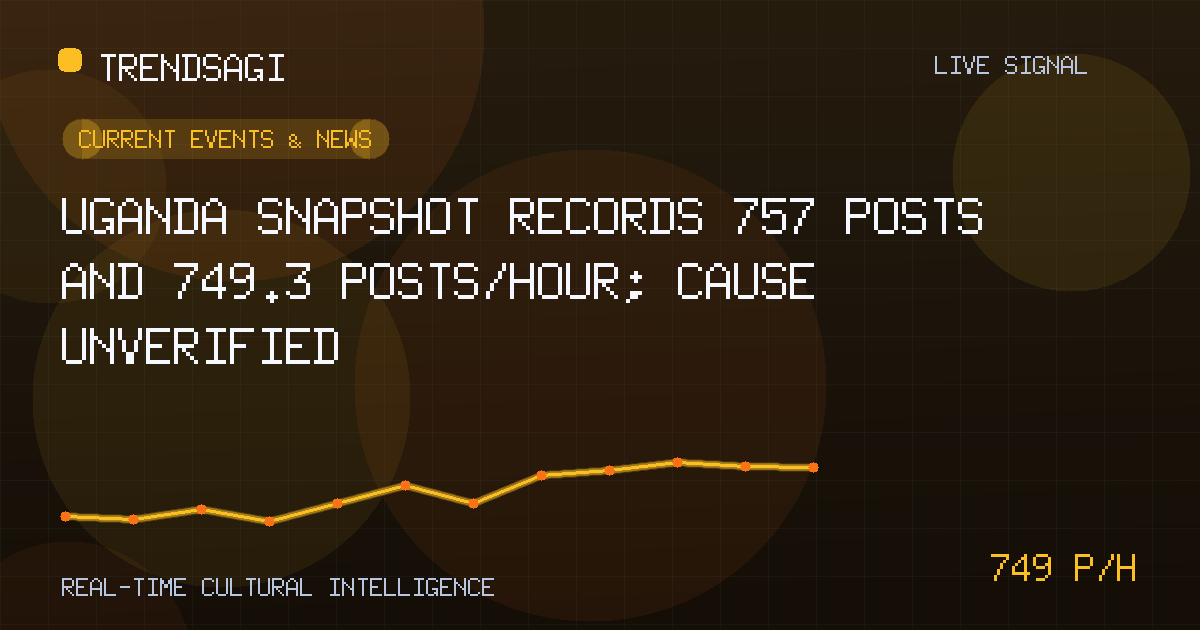
Uganda snapshot records 757 posts and 749.3 posts/hour; cause unverified
Uganda’s latest snapshot shows 757 posts and a measured 749.3 posts/hour rate; the burst is clear, but its public trigger remains unverified.
Automated briefing. Generated from stored signal measurements and source-backed research; it is not manually reviewed. Read the methodology and limitations.
Metrics in this briefing are a snapshot associated with its publication date and may not reflect current conditions.
What changed
The Uganda topic registered a sharp burst of activity in the monitored signal. The latest snapshot contained 757 posts, and the measured snapshot rate was 749.3 posts/hour. No verified public context yet ties that burst to a specific event, so the defensible conclusion is narrow: posts labeled Uganda surged, but the triggering story remains unconfirmed.
The 749.3 figure is a measured snapshot rate, not a live rate, forecast, reach figure, engagement count, or estimate of unique people. It was measured at 2026-10-09T11:54:44Z over an exact 980-second window using 2 stored observations. It describes the pace recorded across those observations; it does not establish how long the activity will last.
| Metric | Stored observation |
|---|---|
| Observation time | 2026-10-09T11:54:44Z |
| Measured snapshot rate | 749.3 posts/hour |
| Latest snapshot volume | 757 posts |
| Measurement window | Exact 980-second window |
| Stored observations | 2 |
Why this topic may be moving
Because the stored description is blank and the label is only Uganda, the signal does not reveal whether discussion centers on politics, public safety, sport, culture, business, or another subject. A broad country label can collect several conversations at once. Without verified reporting or a clear concentration of posts around one event, assigning a cause would be speculation.
- Event convergence: Separate developments may have pushed different post groups under the same label.
- Second-wave reaction: A burst may follow an earlier story rather than a new announcement.
- Reposting and amplification: Repeated sharing can increase post volume without a proportional rise in distinct participants.
- Measurement effects: Labeling rules, collection boundaries, or automated activity may shape what is counted.
These are testable explanations, not established facts. The signal establishes movement in labeled posting volume, not the identity, location, or importance of an underlying event.
The strongest conclusion is that the broad Uganda label experienced a posting burst; it is not yet possible to say which event, if any, caused it.
Why it matters
A high-volume label can attract follow-up coverage quickly, but volume alone is weak evidence of a major development. The distinction matters most to people deciding whether to publish, respond, investigate, or share information.
- Newsrooms and editors should inspect the underlying posts before turning the label into a specific news claim.
- Public institutions, businesses, and civil-society teams with an interest in Uganda should check whether the activity is relevant to their issue area or merely adjacent to it.
- Researchers and analysts should retain the timestamp, collection method, and query definition; otherwise the snapshot cannot be compared reliably with later activity.
- Readers should treat the spike as a prompt to verify the catalyst, not proof that the catalyst exists.
What to watch next
The next useful evidence is a combination of persistence, content, and independent confirmation. A single follow-up item may clarify more than another volume-only snapshot.
- Persistence: Check whether subsequent snapshots remain elevated or quickly return to the prior pattern.
- Event concentration: Sample the underlying items and determine whether one narrative, image, claim, or source accounts for most of the activity.
- Timing: Compare the first appearance of key posts with the start of the measured window; an event may precede the activity rather than cause it.
- Source alignment: Look for a credible report or official statement that independently matches what the sampled posts describe.
- Language and geography: Check whether the label reflects conversation centered in Uganda, discussion from outside the country, or both.
- Issue vocabulary: Recurring names, places, events, and claims can reveal subtopics hidden by the country-only label.
- Cross-platform spread: Replication on independent platforms would strengthen the evidence that attention is broad rather than confined to one collection source.
If those checks identify a coherent event, the briefing can be updated with a sourced explanation. If they do not, the topic should remain described as an unexplained burst.
Methodology and limitations
The snapshot volume and measured rate answer different questions. Volume describes how many posts were present at the observation; the rate describes the measured change across the specified window.
- The 757 posts are a snapshot total, not a rate and not a count of unique people.
- The 749.3 posts/hour figure comes from 2 stored observations across an exact 980-second window, limiting any claim about a longer trend.
- No historical baseline is supplied, so the signal cannot by itself show how unusual the burst is relative to normal activity.
- The label is broad and the stored description contains no event detail, so topic relevance cannot be inferred from the word Uganda alone.
- No verified public context establishes a catalyst. Until one is found, causal attribution would go beyond the evidence.
The practical takeaway is to monitor for confirmation and decomposition, not amplification. Treat 749.3 posts/hour as a dated measurement, and wait for post-level evidence before naming a cause.
Track This Topic for New Signals
Set alerts for future velocity or sentiment changes around this topic.
Explore Tracking PlansAbout TrendsAGI research
TrendsAGI's automated research pipeline publishes dated signal snapshots, methodology notes, and practical workflows for teams evaluating cultural momentum. Read how signals are scoped, scored, and limited in our research methodology.


