903-second window · 2 observations · Measured Oct 6, 2026, 1:26 AM UTC · Provider: go_recent_snapshot_v2
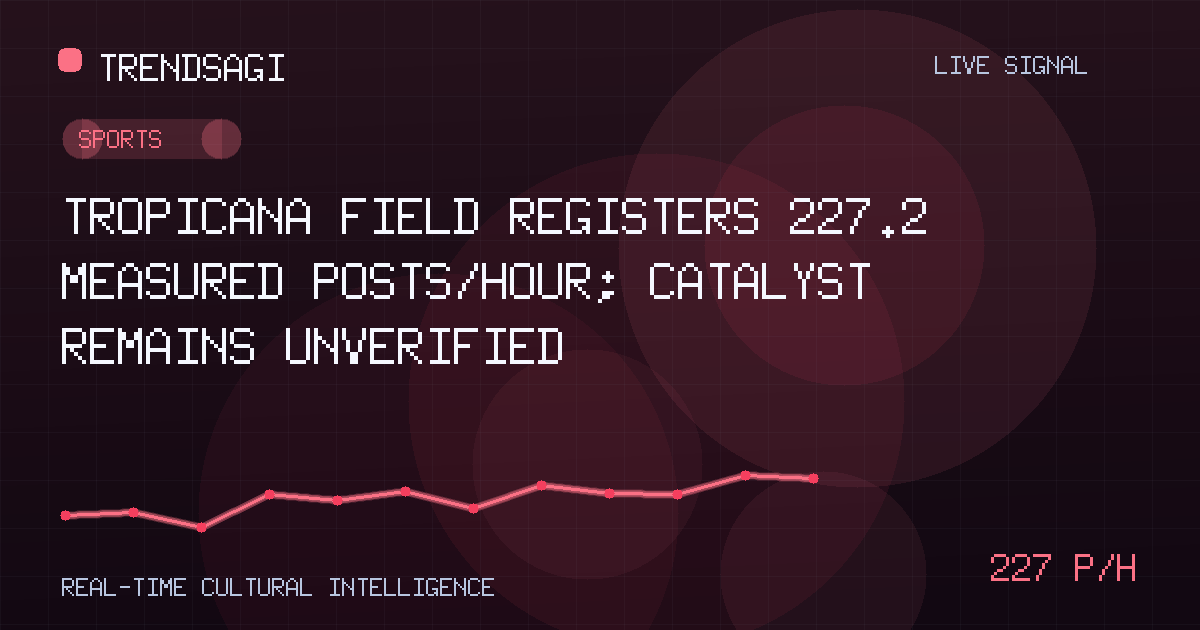
Tropicana Field registers 227.2 measured posts/hour; catalyst remains unverified
Tropicana Field registered 227.2 measured posts/hour over 903 seconds; the latest snapshot had 126 posts, and editors should verify the catalyst.
Automated briefing. Generated from stored signal measurements and source-backed research; it is not manually reviewed. Read the methodology and limitations.
Metrics in this briefing are a snapshot associated with its publication date and may not reflect current conditions.
What changed
The stored signal shows a sharp rise in posting activity labeled “Tropicana Field,” but the record does not establish why it happened. The defensible conclusion is limited: activity increased at a measured snapshot rate during a short comparison window. No verified game result, announcement, incident, or other public event can yet be identified as the cause, so the topic should not be presented as a confirmed news event.
The latest observation was recorded at 2026-10-06T01:26:49Z. Across an exact 903-second window using two stored observations, the signal registered 227.2 posts per hour. That figure is a measured snapshot rate, not a live or current rate, forecast, reach, engagement, or unique-person count. The latest snapshot contained 126 posts, which is a separate volume measure rather than a rate.
| Observation time | Measured snapshot rate | Latest snapshot volume |
|---|---|---|
| 2026-10-06T01:26:49Z | 227.2 posts/hour | 126 posts |
Why this topic may be moving
The signal is stored under the Sports category, but its description is empty. That category assignment does not reveal the specific event, participant, location, or announcement behind the increase. Several explanations should therefore be treated as hypotheses to test rather than facts:
- A time-linked sports event: A result, schedule change, appearance, or post-event reaction could have produced concentrated discussion near the observation window.
- An official announcement: A release from an organization associated with the topic could have prompted accounts to publish the same label or linked update.
- A local or breaking report: A reporter’s timestamped post may have accelerated circulation before a broader explanation appeared.
- A secondary-information spike: A widely shared clip, quotation, or reaction may have generated more posts than the original item warranted.
- A collection or distribution artifact: Repetition, quoted posts, automated accounts, or changes in matching rules could inflate activity attributed to the label without representing equivalent public interest.
Timing and content are the critical tests. A verified catalyst should have a publication or occurrence time that plausibly precedes the measured increase, while sampled posts should show what information people were actually sharing.
The strongest supported conclusion is that posting activity labeled “Tropicana Field” increased sharply within this stored comparison. The evidence does not yet identify what happened, who initiated the activity, or whether the posts came from distinct people.
Why it matters
For sports and local-news editors, the immediate risk is false attribution. Publishing a game result, venue announcement, or incident as the cause before checking timestamps would turn a fast-moving label into an unsupported story. The signal is useful as a prompt for verification, but not as a substitute for reporting.
Teams, venue operators, event organizations, and communications teams should care if the activity reflects an operational issue, a schedule change, or unusually concentrated audience attention. Even then, post volume alone cannot establish attendance, physical presence, or service demand. Those conclusions would require separate, directly verified evidence.
Audience and brand researchers should also distinguish conversation volume from human attention. The 126-post snapshot does not reveal how many people participated, whether many posts were duplicates, or whether readers expressed approval, criticism, confusion, or neutral information sharing.
Trend and platform teams should treat the result as an anomaly worth auditing. Two observations can identify a measured change, but they cannot show whether the pattern is sustained, recurring, or generated by a narrow distribution loop.
What to watch next
- Search for a timestamp-matched explanation. Use Google Search for the exact label paired with the observation date, then examine results that were published close to the recorded window. Any external fact should be attributed to the publisher that reported it. If no credible explanation can be verified, the cause should remain explicitly unclear.
- Inspect the earliest and most repeated posts. Determine whether the first substantive item came from an official account, reporter, participant, or ordinary poster. Classify samples as original reporting, quotation, reaction, or duplication without converting post counts into unique-person estimates.
- Test whether the spike persists. Collect later snapshots using the same topic-matching and counting method. Persistence across several comparable observations would support a broader conversation; disappearance immediately after the window would be more consistent with a short burst.
- Check the specificity of the discussion. Look for event names, locations, organization references, result language, or incident terms. A label dominated by generic reactions may be less actionable than one tied to a confirmed development.
- Review distribution quality. Look for repeated wording, synchronized bursts, unsupported claims, or high posting frequency from a limited set of accounts. These are warning signs for an automated or coordinated spike, but they require evidence rather than assumption.
Concrete watch signals are a verified catalyst inside the relevant time window, continued activity under consistent collection rules, greater diversity of original posts, and a recognizable shift from generic references to specific event reporting. A further rise without those qualifications would still indicate posting acceleration, not necessarily greater real-world importance.
Methodology and limitations
The reported 227.2 posts per hour comes from two stored observations over an exact 903-second window ending at 2026-10-06T01:26:49Z. It is a measured snapshot rate associated with that comparison only. It is not a live or current rate, forecast, total audience, engagement measure, or count of unique people.
The latest snapshot volume of 126 posts is a separate observed count. It should not be used as the hourly rate or treated as evidence of reach. The record also does not provide the underlying post text, collection query, matching rules, geography, account composition, or sentiment.
No verified public catalyst is present in the stored record, and the empty signal description leaves the context unresolved. With only two observations, the available evidence can establish a short-window change in labeled posting activity, but not its duration, cause, organic character, or broader significance.
Track This Topic for New Signals
Set alerts for future velocity or sentiment changes around this topic.
Explore Tracking PlansAbout TrendsAGI research
TrendsAGI's automated research pipeline publishes dated signal snapshots, methodology notes, and practical workflows for teams evaluating cultural momentum. Read how signals are scoped, scored, and limited in our research methodology.


