898-second window · 3 observations · Measured Sep 28, 2026, 6:55 PM UTC · Provider: go_recent_snapshot_v2
Tracked UK post activity rose at a measured 2293.4 posts/hour; the trigger remains unclear
UK-topic activity rose at a measured 2293.4 posts/hour. Learn what the spike shows, what it cannot prove, and which checks should come next.
Automated briefing. Generated from stored signal measurements and source-backed research; it is not manually reviewed. Read the methodology and limitations.
Metrics in this briefing are a snapshot associated with its publication date and may not reflect current conditions.
What changed
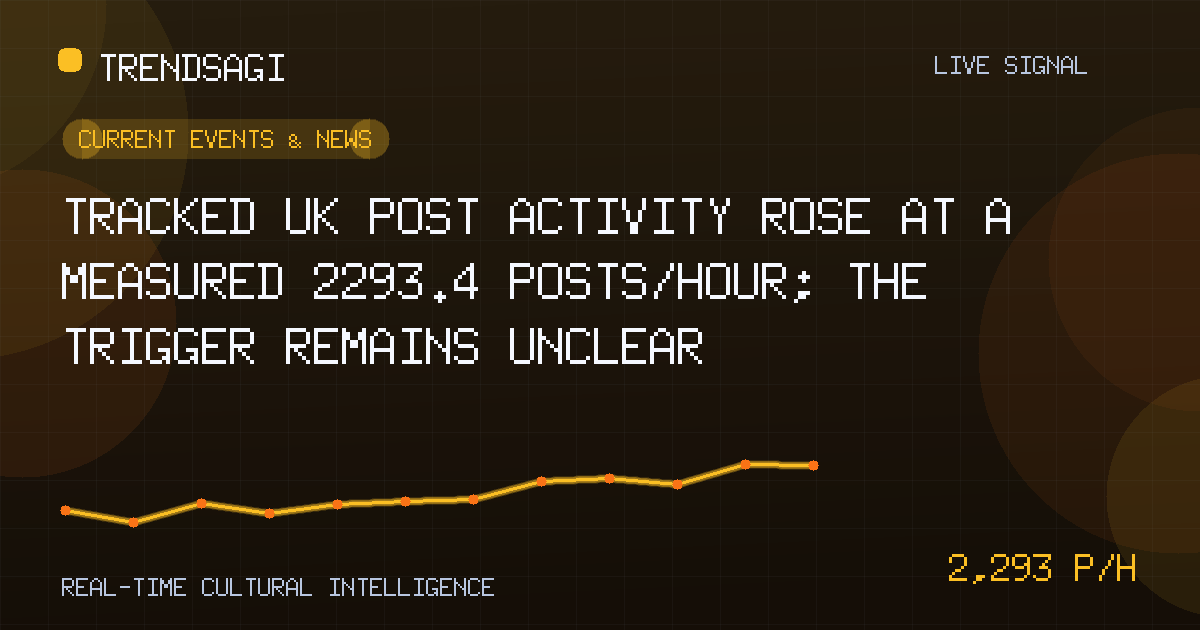
The tracked topic labeled “The UK” shows a short-window rise in posting activity, with a measured change rate of 2293.4 posts/hour. The direct answer is to treat this as an investigation alert, not proof of a particular news event: the stored signal has no description or verified public context identifying the trigger, so why it moved remains unclear.
Across an exact 898-second window using 3 stored observations, measured at 2026-09-28T18:55:21Z, the measured snapshot rate was 2293.4 posts/hour. The latest snapshot volume is 4000 posts. The posts/hour figure describes that measured snapshot; it is not a live or current rate, forecast, reach figure, engagement count, or count of unique people.
| Observation time | Measured snapshot rate | Snapshot volume |
|---|---|---|
| 2026-09-28T18:55:21Z | 2293.4 posts/hour | 4000 posts |
Taken together, the figures justify prompt inspection of the monitored sample. They do not by themselves show that sentiment changed, that the increase will continue, or that the posts concern UK domestic affairs rather than an international story with a UK angle.
Why this topic may be moving
The only supplied classification is Current Events & News. That makes event-driven attention plausible, but a category label is not evidence of a specific catalyst. Several mechanisms could produce the measured rise, and the available record cannot distinguish among them.
- A breaking-news event may have prompted a rapid response. The next step is to identify the recurring headline or factual claim and compare its timing with credible public reporting.
- A scheduled political, sporting, cultural or market event may have created a predictable discussion peak. No particular event is verified in the stored signal.
- The geographic label may be combining unrelated story clusters. Activity can rise because one subtopic is accelerating, not because every part of UK-related discussion is moving together.
- Distribution effects may also matter. Repetition, a high-visibility account, recommendation changes or coordinated posting can increase volume without representing broad public interest. None of these explanations is established here.
Because event metadata is absent, causal confidence is low. Attributing the increase to a government announcement, election, royal event, economic release or another specific story would go beyond the evidence. Until an event-level explanation is verified, the cause should be reported as unknown.
What the signal can and cannot establish
The signal supports a limited but useful set of conclusions:
- Tracked posting activity increased at the stated measured snapshot rate.
- The observation is tied to a precise timestamp and an exact measurement window.
- The 4000-post snapshot provides material for immediate event-level investigation.
- The result gives editors a reference point for checking whether activity persists in a subsequent comparable snapshot.
It does not establish:
- which event, person or institution caused the movement;
- whether sentiment became more positive, negative or urgent;
- how many unique people participated;
- whether the posts were original, repetitive, automated or coordinated;
- whether the sample represents UK public opinion; or
- whether the increase is part of a durable trend rather than a brief burst.
A posting surge is a reason to investigate quickly, but it is not evidence of a corresponding surge in public concern, agreement or importance.
Why it matters
Newsrooms and editors need to find the specific story before using a broad “The UK” label in a headline or bulletin. Communications, public-affairs and monitoring teams may need to determine whether the movement reflects meaningful stakeholder response, while analysts need to test whether the rise is concentrated or broadly distributed.
The key risk is false precision. A strong rate can make an ambiguous signal feel explained even when no catalyst has been identified. The appropriate response is not to discard the alert, but to hold the causal claim at the same confidence level as the evidence.
What to watch next
Practical checks should move from aggregate volume to the contents and structure of the snapshot:
- Cluster the 4000 posts by recurring headline, named entity, URL and thread. Record when each cluster first appears and whether one cluster dominates the rise.
- Separate original posts from duplicates and reactions where the available fields permit. Check account concentration and avoid treating repeated distribution as a broad base of unique participants.
- Test a candidate catalyst against public reporting. Compare publication and update times with the measurement window, attribute factual claims to their publishers, and retain “cause unclear” if no credible event aligns.
- Compare the result with a longer, consistently filtered baseline. Individual stored observations, query scope and collection details should be reviewed before deciding whether 2293.4 posts/hour is exceptional.
- Repeat the same 898-second measurement using the same topic definition and collection rules. A comparable subsequent snapshot will show whether the burst persists, cools or was confined to the observed interval.
Concrete signals to watch
- One verified event begins to account for most of the activity.
- Several unrelated story clusters rise at the same time, indicating broader label-level movement.
- Verified reporting aligns closely with the first appearance of the dominant cluster.
- Original contributions broaden across accounts rather than remaining concentrated or repetitive.
- The rate remains elevated in the next comparable measurement window.
- The topic label, language, category or filtering rules change during monitoring.
Methodology and limitations
This briefing uses the stored observation timestamped 2026-09-28T18:55:21Z. The supplied measured change rate is 2293.4 posts/hour over an exact 898-second window using 3 stored observations. The latest snapshot volume is 4000 posts. The rate should not be extrapolated beyond that measured window, and the snapshot volume must not be interpreted as a rate.
The underlying observation values, collection platform, query scope, source mix, geographic method, sentiment and account-level deduplication rules are not described in the available signal. That prevents full reproducibility and limits conclusions about representativeness. A short window based on 3 observations can also be dominated by a sudden burst.
The timestamp marks when the signal was observed, not necessarily when an underlying event began. The defensible conclusion is therefore that tracked UK-topic activity rose sharply enough to require investigation, while the triggering story remains unverified.
Track This Topic for New Signals
Set alerts for future velocity or sentiment changes around this topic.
Explore Tracking PlansAbout TrendsAGI research
TrendsAGI's automated research pipeline publishes dated signal snapshots, methodology notes, and practical workflows for teams evaluating cultural momentum. Read how signals are scoped, scored, and limited in our research methodology.


