1838-second window · 2 observations · Measured Oct 10, 2026, 12:27 PM UTC · Provider: go_recent_snapshot_v2
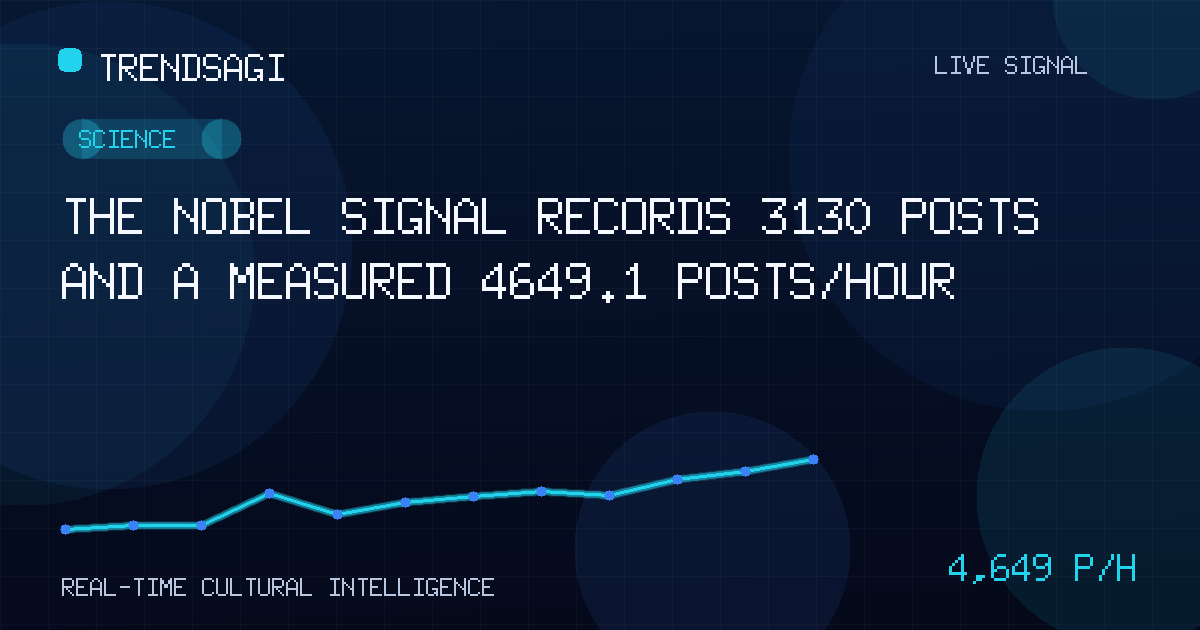
The Nobel signal records 3130 posts and a measured 4649.1 posts/hour
The Nobel’s stored signal shows 3130 posts and a measured 4649.1 posts/hour; the cause remains unverified, with practical checks next.
Automated briefing. Generated from stored signal measurements and source-backed research; it is not manually reviewed. Read the methodology and limitations.
Metrics in this briefing are a snapshot associated with its publication date and may not reflect current conditions.
What changed
The stored “The Nobel” signal contains 3130 posts at 2026-10-10T12:27:10Z. Over an exact 1838-second window using 2 stored observations, the measured change rate was 4649.1 posts/hour. The direct conclusion is narrow: the monitored collection registered a measured increase under this label, but the available record does not identify the news event behind it.
The 4649.1 figure is a measured snapshot rate—not a live or current rate, forecast, reach figure, engagement total, or unique-person count. The 3130 figure is snapshot volume, not a rate. The metrics should be read separately: one describes change during the measurement window; the other describes the collection at the observation time.
| Observation time | 2026-10-10T12:27:10Z |
|---|---|
| Measured snapshot rate | 4649.1 posts/hour |
| Latest snapshot volume | 3130 posts |
| Measurement basis | Exact 1838-second window; 2 stored observations |
Why this topic may be moving
No verified public item is available in the supplied record to tie to the acceleration, so the cause remains unclear. The stored category, “Science,” supplies a subject area but does not prove that posts concerned the Nobel Prize, a laureate, an institution, or a controversy. “The Nobel” is too broad on its own to support an event-level conclusion.
- A time-limited announcement or publication could have started a reporting wave; that is a hypothesis, not a verified finding.
- An older story could have resurfaced, producing new posts without a new underlying event.
- Reaction, quotation, or aggregation could amplify a label while adding little original reporting.
- Ambiguous matching could combine unrelated uses of “Nobel,” weakening any single interpretation.
A publisher or public account should be connected to the timing before it is named as the cause. Without that link, saying that a particular announcement “drove” the signal would go beyond the evidence.
Why it matters
For science desks, research teams, and communications professionals, the immediate issue is triage. A high-volume label can indicate an event worth examining, but it can also be a noisy bundle of repetition, reaction, and mismatched language. The number alone cannot tell them whether to prepare a live update, publish an explainer, verify a claim, or wait for more evidence.
A measured rise in posts under a broad label establishes post activity, not the identity, importance, or accuracy of the event being discussed.
The signal also matters for trend interpretation. Snapshot volume shows how much material is present in the monitored collection at a moment; the measured rate shows how that collection changed over the specified window. Neither establishes how many people saw the posts, whether the authors are unique, or whether the underlying claims are credible. Editorial value comes from resolving those gaps, not from repeating the velocity as if it were impact.
What to watch next
The next useful step is to turn the broad label into an evidence chain:
- Inspect the matching posts. Review a representative slice from the measurement window for exact wording, links, timestamps, language, geography, and account type. Determine what “Nobel” refers to and whether the same story dominates.
- Check timing against public coverage. Use Google Search for the label and close time candidates, then open the underlying pages. Record each publisher, publication time, update time, and the specific event named. Search snippets alone are insufficient.
- Test the causal sequence. A candidate cause should precede the measured increase, be reflected in the matching posts, and appear across independent publishers or accounts. If those conditions fail, retain “cause unclear.”
- Separate original reporting from repetition. Group duplicate text, syndicated copies, quote posts, and reactions. Do not label activity automated or coordinated without evidence; simply show how much of the volume is original.
- Collect comparable observations. Keep the query, collection, label logic, and measurement method stable. Additional snapshots can show whether activity persists, decays, or migrates to a more specific label; a single next point cannot establish a trend by itself.
- Watch for concrete confirmation. Useful signals include a timestamped public item aligned with the window, a sharp concentration around a named entity, a clear language or geography cluster, and a change in the mix of original posts versus quotations.
If later checks align those signals, the briefing can move from “what changed” to “why.” Until then, the responsible description remains a measured post increase under an ambiguous topic label.
Methodology and limitations
This briefing uses the canonical observation at 2026-10-10T12:27:10Z: 3130 posts in the latest snapshot and a measured rate of 4649.1 posts/hour over an exact 1838-second window based on 2 observations. The rate is a measured comparison between those stored points; it is not an independently observed live feed. No historical baseline is supplied, so the record cannot show whether the rate is unusual for this topic or predict what comes next.
The signal also does not specify the collection’s platform mix, geographic and language coverage, sampling method, deduplication rules, or account distribution. The label has no stored description, and no post text or verified source is included here. As a result, the data supports a concise statement about observed post activity and its measured change, but not a definitive statement about why “The Nobel” moved, who participated, what they believed, or whether any claim was true.
Track This Topic for New Signals
Set alerts for future velocity or sentiment changes around this topic.
Explore Tracking PlansAbout TrendsAGI research
TrendsAGI's automated research pipeline publishes dated signal snapshots, methodology notes, and practical workflows for teams evaluating cultural momentum. Read how signals are scoped, scored, and limited in our research methodology.


