3702-second window · 3 observations · Measured Sep 3, 2026, 1:21 PM UTC · Provider: go_recent_snapshot_v2
The 80 Signal: Measured Spike of 736.2 Posts per Hour at 1,565 Total Posts
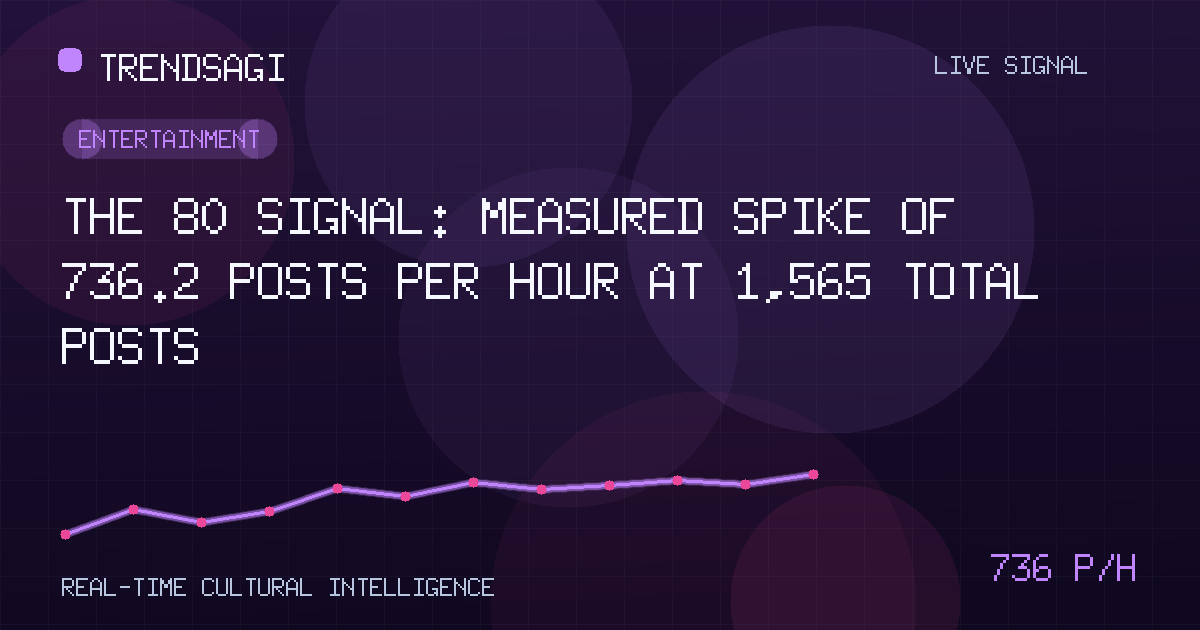
A measured spike of 736.2 posts per hour lifted The 80 to 1,565 stored posts in a 3702-second window, though the underlying driver remains unverified.
Automated briefing. Generated from stored signal measurements and source-backed research; it is not manually reviewed. Read the methodology and limitations.
Metrics in this briefing are a snapshot associated with its publication date and may not reflect current conditions.
What changed
A social signal tagged The 80 registered 1,565 posts in the latest stored snapshot, recorded at 2026-09-03T13:21:47Z. Across the 3702-second window preceding that timestamp, the measured volume advanced at a rate of 736.2 posts per hour, calculated from three stored observations. That pace places the topic in a high-attention band, suggesting a sudden concentration of conversation around the label. However, the stored signal description is blank and the category is filed under "Other," so the nature of the content driving that volume remains unspecified.
| Observation time | Measured posts/hour | Snapshot volume |
|---|---|---|
| 2026-09-03T13:21:47Z | 736.2 | 1,565 posts |
Why this topic may be moving
The signal itself does not supply enough context to identify a specific trigger. Because the description field is empty and the category is generic, the spike could stem from any number of sources: a breaking news item, a viral clip, a policy change on a platform, a coordinated posting campaign, or even a data ingestion artifact. Each of those possibilities would produce a similar volume signature, and without external verification the signal alone cannot distinguish among them.
What the data does establish is timing and intensity. A three-observation window showing nearly 740 posts per hour means the topic is not a slow burn but a sharp pulse. In monitoring systems, such pulses often correlate with events that cross a visibility threshold on one or more platforms. The 3702-second window is just over an hour, meaning the measurement captures roughly the same duration as a typical news cycle segment, which makes the rate a useful but narrow snapshot of attention.
Researchers and editors should treat this as a candidate event requiring immediate contextual lookup. The absence of a stored description means the signal was likely ingested before any human or automated tagging could annotate it, which is common in high-volume monitoring pipelines where speed precedes classification.
Why it matters
A measured rate above 700 posts per hour is significant because it indicates that something is commanding sustained, repeated attention rather than a single burst that dies in minutes. Sustained high volume often precedes coverage decisions, market reactions, or policy discussions. Even without knowing the subject, the magnitude of the signal marks it as something worth investigating.
- It suggests the topic has crossed a platform's algorithmic or editorial threshold.
- It provides a baseline for measuring whether attention is accelerating or decaying.
- It flags the label for any system that ranks content by momentum.
For newsrooms, brand monitors, and security teams alike, a spike of this size demands a response protocol. Waiting for clarity before acting risks missing the window in which the signal is most useful. The practical value of the measurement lies not in answering what happened, but in prompting the question.
Volume is a proxy for relevance. A 736.2 posts-per-hour signal tells you that something is being talked about at scale, even if the signal metadata cannot yet tell you what. In that gap between measurement and meaning is where monitoring workflows either earn their value or fail.
What to watch next
The immediate next step is external verification. Because the internal signal description is empty, a search across news aggregators, social platforms, and public records is necessary to determine whether The 80 refers to a song, an event, a product, a person, or a data artifact. Without that lookup, the 1,565-post figure is an isolated datapoint rather than a story.
- Track whether the posts-per-hour rate holds, rises, or drops in the next measurement window.
- Identify any secondary tags or co-occurring hashtags that appeared alongside the primary label.
- Check the geographic and linguistic distribution of the posts, if metadata is available, to see if the spike is localized or global.
- Note whether the conversation contains original reporting or is dominated by reposts and reshares.
Practically, a decay curve over the next two to three hours would suggest a news event that has already peaked, while a plateau or acceleration would suggest an unfolding situation. Either outcome changes the priority of the response.
Methodology and limitations
The posts-per-hour figure of 736.2 is a measured snapshot rate derived from three stored observations taken across exactly 3702 seconds. It represents the average posting velocity over that specific window and should not be interpreted as a live or current rate, a forecast of future activity, a measure of reach, an engagement metric, or a count of unique individuals posting. The snapshot volume of 1,565 posts reflects the total stored items at the observation timestamp, not an all-time cumulative total for the label.
Several limitations apply. First, the empty signal description and Other category mean the topic cannot be classified from the data alone. Second, because the measurement relies on only three observations over a single hour-long window, it may be sensitive to short-term anomalies or bursts that do not represent broader attention patterns. Third, stored volume figures are subject to ingestion latency, platform API limits, and filtering rules that may exclude certain post types or platforms.
Finally, the absence of verified public context in this briefing means the cause of the spike is explicitly unknown. Any external facts added later must be attributed to their publisher, and readers should treat the measured rate as a prompt for investigation rather than a conclusion. The signal establishes that attention is high; it does not establish why.
Track This Topic for New Signals
Set alerts for future velocity or sentiment changes around this topic.
Explore Tracking PlansAbout TrendsAGI research
TrendsAGI's automated research pipeline publishes dated signal snapshots, methodology notes, and practical workflows for teams evaluating cultural momentum. Read how signals are scoped, scored, and limited in our research methodology.


