1227-second window · 2 observations · Measured Aug 26, 2026, 2:09 AM UTC · Provider: go_recent_snapshot_v1
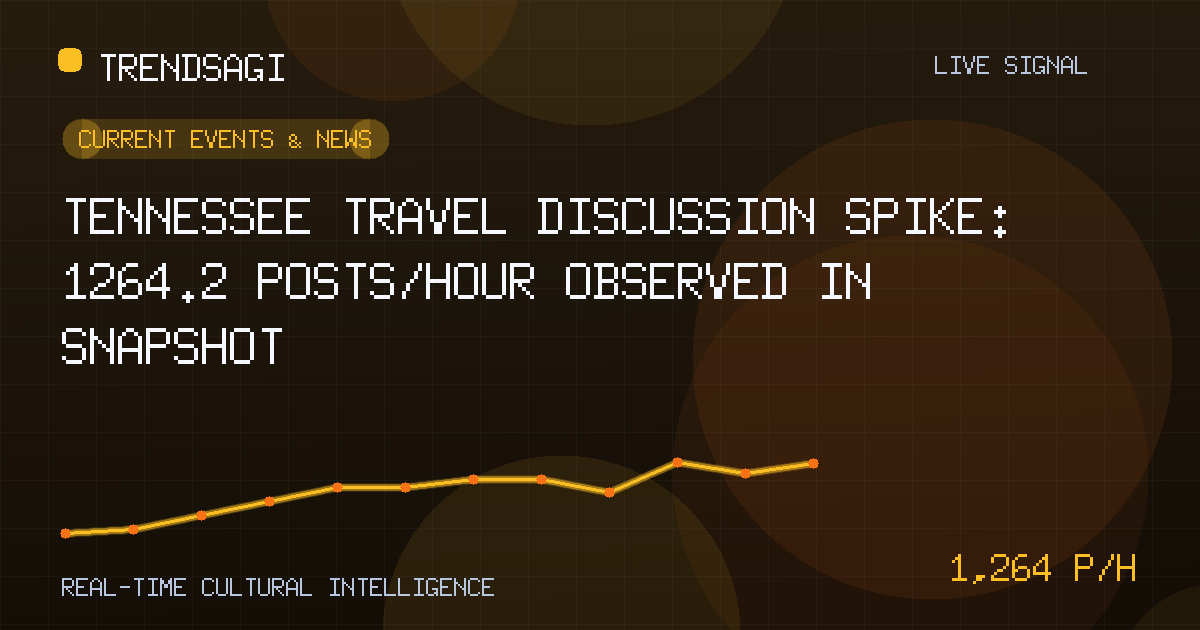
Tennessee Travel Discussion Spike: 1264.2 Posts/Hour Observed in Snapshot
Snapshot shows Tennessee travel discussions spiking at 1264.2 posts/hour, prompting investigation into potential events or news driving online activity.
Automated briefing. Generated from stored signal measurements and source-backed research; it is not manually reviewed. Read the methodology and limitations.
Metrics in this briefing are a snapshot associated with its publication date and may not reflect current conditions.
What changed
There has been a sharp and sudden surge in online discussions about Tennessee, with a measured snapshot rate of 1264.2 posts per hour. This activity was captured at 02:09:51 UTC on August 26, 2026, from a snapshot volume of 431 posts, indicating a significant uptick in a short period.
| Observation Time (UTC) | Measured Posts/Hour | Snapshot Volume |
|---|---|---|
| 2026-08-26T02:09:51Z | 1264.2 | 431 posts |
This rate was calculated over a 1227-second window, equivalent to approximately 20.45 minutes, reflecting a rapid increase rather than a steady trend. The topic falls under the "Travel and transportation" category, suggesting the spike may relate to mobility, events, or tourism.
Why this topic may be moving
The exact cause of this increase is unclear without verification through external sources, as the stored signal description is empty. Based on the travel category, potential drivers could include a variety of events or news affecting Tennessee. For instance, it might be linked to upcoming festivals like Bonnaroo or sports events such as NFL games, which often generate buzz. Alternatively, travel disruptions—like road closures on Interstate 40 or flight delays at Nashville International Airport—could spark conversations among commuters and tourists. Viral social media campaigns promoting Tennessee's attractions, such as the Great Smoky Mountains or live music venues, might also amplify discussion.
To pinpoint the reason, checking recent headlines from local outlets like The Tennessean or travel industry reports would be prudent. Without this, any interpretation remains speculative, highlighting the need for further research.
Why it matters
This surge in posts can have practical implications for various groups, making it a signal worth monitoring:
- Travelers and tourists: They should stay informed about potential crowding at popular sites like Dollywood or Gatlinburg, or unexpected changes in transportation networks that could impact itineraries.
- Local businesses: Hotels, restaurants, and attractions in cities like Memphis or Chattanooga might see increased demand or logistical challenges if the spike relates to a specific event.
- Marketers and analysts: This data presents an opportunity to engage with a growing audience or adjust campaigns based on emerging travel trends.
- Authorities and planners: If the spike signals safety concerns or infrastructure issues, it could necessitate timely public updates or resource allocation.
The measured rate of 1264.2 posts per hour is a snapshot from an untrusted data source, not a live metric. It captures a moment of heightened activity that could be a precursor to a larger trend or simply a fleeting anomaly.
What to watch next
To build on this signal and uncover its meaning, consider these practical next steps:
- Verify with trusted sources: Scan news outlets for announcements related to Tennessee travel, such as events, weather alerts, or policy changes.
- Monitor social platforms: Track hashtags like #TennesseeTravel or keywords on Twitter and Reddit to see if the conversation clarifies or evolves.
- Check for official statements: Look for updates from the Tennessee Department of Tourist Development or transportation agencies like TDOT.
- Analyze sentiment and content: If possible, review sample posts to determine whether they reflect excitement, complaints, or neutral information, which could shape response strategies.
Concrete watch signals include a sustained rise in flight searches to Nashville, increased hotel bookings in the state, or emergency notifications that might explain the spike. Observing these in the next 24-48 hours will help assess if this is a passing blip or the start of a broader movement.
Methodology and limitations
This briefing is based on a single snapshot observation from an untrusted data source. The measured posts per hour is a rate calculated over a specific window of 1227 seconds and should not be interpreted as a current, live, or forecasted rate. It represents activity captured at one point in time, and the snapshot volume of 431 posts indicates the scale of discussion at that moment.
Key limitations include:
- Lack of context: Without the actual post content or verified external facts, the underlying cause remains unknown, making this signal suggestive but not explanatory.
- Snapshot nature: This is a point-in-time measurement; trends may not persist, and the rate could fluctuate rapidly.
- No attribution: The authenticity, relevance, or reach of the posts cannot be verified without further analysis, such as cross-referencing with other datasets.
For a more accurate understanding, this data should be combined with human judgment and additional sources, like news archives or analytics tools, to avoid misinterpretation.
Track This Topic for New Signals
Set alerts for future velocity or sentiment changes around this topic.
Explore Tracking PlansAbout TrendsAGI research
TrendsAGI's automated research pipeline publishes dated signal snapshots, methodology notes, and practical workflows for teams evaluating cultural momentum. Read how signals are scoped, scored, and limited in our research methodology.


