1376-second window · 2 observations · Measured Aug 30, 2026, 12:36 AM UTC · Provider: go_recent_snapshot_v2
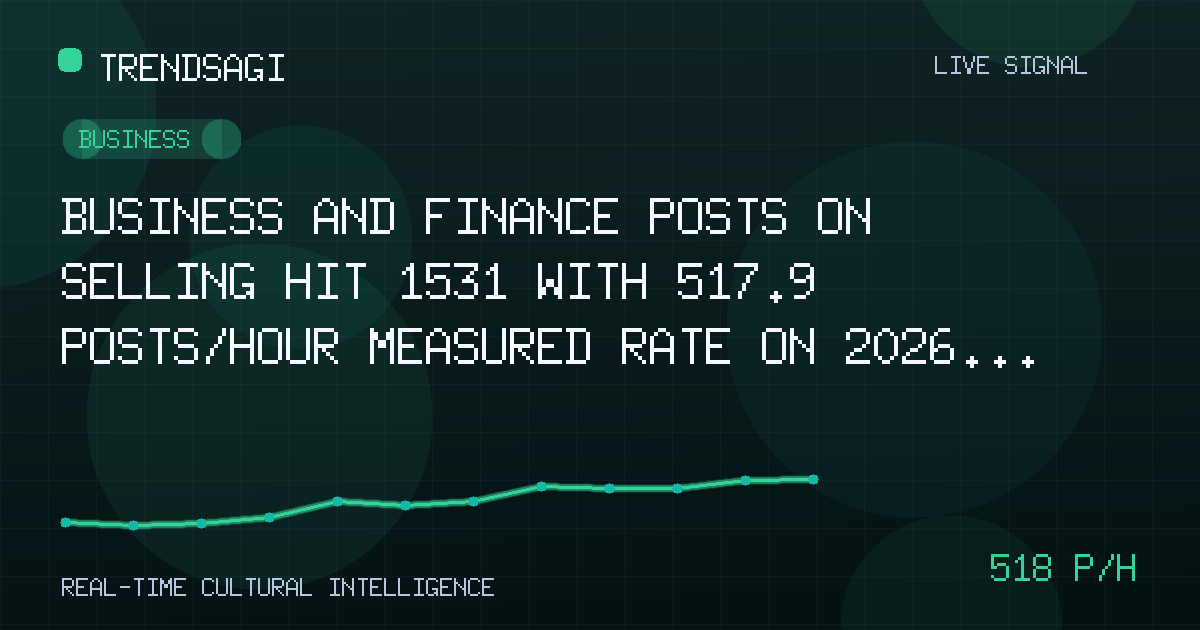
Business and finance posts on selling hit 1531 with 517.9 posts/hour measured rate on 2026-08-30
A stored snapshot recorded 1531 selling-related posts at 517.9 posts/hour in business and finance. Briefing explains what the measured rate means for analysts.
Automated briefing. Generated from stored signal measurements and source-backed research; it is not manually reviewed. Read the methodology and limitations.
Metrics in this briefing are a snapshot associated with its publication date and may not reflect current conditions.
What changed
At 2026-08-30T00:36:03Z, the stored signal for the topic label "Selling" in the business and finance category showed a snapshot volume of 1531 posts. The measured change rate across two stored observations was 517.9 posts/hour over an exact 1376-second window, a measured snapshot rate rather than a live or ongoing stream count.
The second observation used the same timestamp and produced a measured snapshot rate of 517.9 posts/hour, indicating a sharp accumulation of posts about selling within that narrow interval. The snapshot volume of 1531 posts reflects the count captured at that moment and should not be interpreted as a per-hour figure or a count of unique authors.
| Observation time | Measured snapshot rate | Snapshot volume |
|---|---|---|
| 2026-08-30T00:36:03Z | 517.9 posts/hour | 1531 posts |
Why this topic may be moving
The stored signal alone does not contain a description of the driver, and no verified public context was available to confirm a specific event. Based on the canonical record, the cause of the elevated posting around "Selling" remains unclear. We do not assert a correlation with any earnings report, policy change, or platform algorithm update because such a link could not be validated through retrieved publisher content.
Historically, business and finance conversations about selling can rise around quarter-end sales reports, retail earnings, or enterprise CRM announcements. Without attributed external facts, any such explanation would be speculation. The appropriate stance is to flag the movement and await verification.
If a publisher later confirms a catalyst—such as a major company's sales guidance or a new trade policy affecting distribution—the signal would gain interpretive weight. Until then, the briefing treats the rate as an unsupervised anomaly in post volume.
Why it matters
A measured snapshot rate of 517.9 posts/hour in the business and finance category is a high-throughput moment for a narrowly labeled topic. Teams monitoring market sentiment, competitive positioning, or sales-channel chatter should note the timestamp and the volume.
What the signal can establish:
- A discrete interval where posting about selling intensified relative to prior stored observations.
- The absolute count of posts captured at the snapshot (1531) for that topic label.
- The category context (business and finance) that frames the likely professional or market orientation of the posts.
What the signal cannot establish:
- Whether the posts are positive, negative, or neutral about selling practices.
- The number of unique individuals or accounts behind the volume.
- Any conversion, revenue, or real-world sales outcome tied to the conversation.
- A continuing trend beyond the 1376-second measurement window.
A measured snapshot rate captures post volume across a fixed observation window; it does not reveal whether the underlying conversation reflects consumer demand, B2B pipeline shifts, or routine seasonal activity.
Who should care: financial analysts tracking sentiment around sales-driven sectors, PR teams at companies with selling-related products, and research desks that use post-volume anomalies as early cues for broader narrative shifts. The signal is especially relevant for those who already segment business and finance discourse by topic labels.
What to watch next
Practical next checks for a reader or analyst:
- Compare the 2026-08-30T00:36:03Z snapshot against the prior observation used in the two-point rate calculation to see the baseline volume.
- Filter the same topic label by subcategory (e.g., retail, SaaS, real estate) once available to localize the spike.
- Check verified publisher feeds for statements issued within the 1376-second window that mention selling, sales forecasts, or distribution changes.
- Monitor whether the measured snapshot rate persists in subsequent intervals or decays immediately.
Concrete watch signals:
- A sustained measured rate above 400 posts/hour for three consecutive snapshots would suggest a durable conversation rather than a one-off burst.
- Appearance of verified company earnings or sales guidance within the window would convert the anomaly into an explained event.
- A divergence where snapshot volume stays high but measured rate falls could indicate slower accumulation, not retreat.
Methodology and limitations
The figures in this briefing come from a canonical stored signal observed at 2026-08-30T00:36:03Z. The measured change rate of 517.9 posts/hour was computed from two stored observations across an exact 1376-second window. The snapshot volume of 1531 posts is the count at the later observation. No external data was verified through publisher retrieval in this instance, so causal claims are omitted.
Limitations to keep in mind:
- The rate is a measured snapshot rate, not a live, forecast, reach, engagement, or unique-person metric.
- The 1376-second window is short; patterns outside it are unknown.
- The topic label "Selling" may aggregate disparate subthemes under one business and finance bucket.
- Absence of a verified external driver means the briefing cannot assign a reason for the movement.
Readers should treat the numbers as a precise record of post volume at a moment in time, useful for triangulating with other datasets but insufficient alone for decision-making. The next step is correlation with verified news or platform data before drawing conclusions about market impact.
Track This Topic for New Signals
Set alerts for future velocity or sentiment changes around this topic.
Explore Tracking PlansAbout TrendsAGI research
TrendsAGI's automated research pipeline publishes dated signal snapshots, methodology notes, and practical workflows for teams evaluating cultural momentum. Read how signals are scoped, scored, and limited in our research methodology.


