905-second window · 2 observations · Measured Oct 8, 2026, 6:56 AM UTC · Provider: go_recent_snapshot_v2
Santa Cloud Skin Sunstick rises at a measured 1204.7 posts/hour snapshot rate
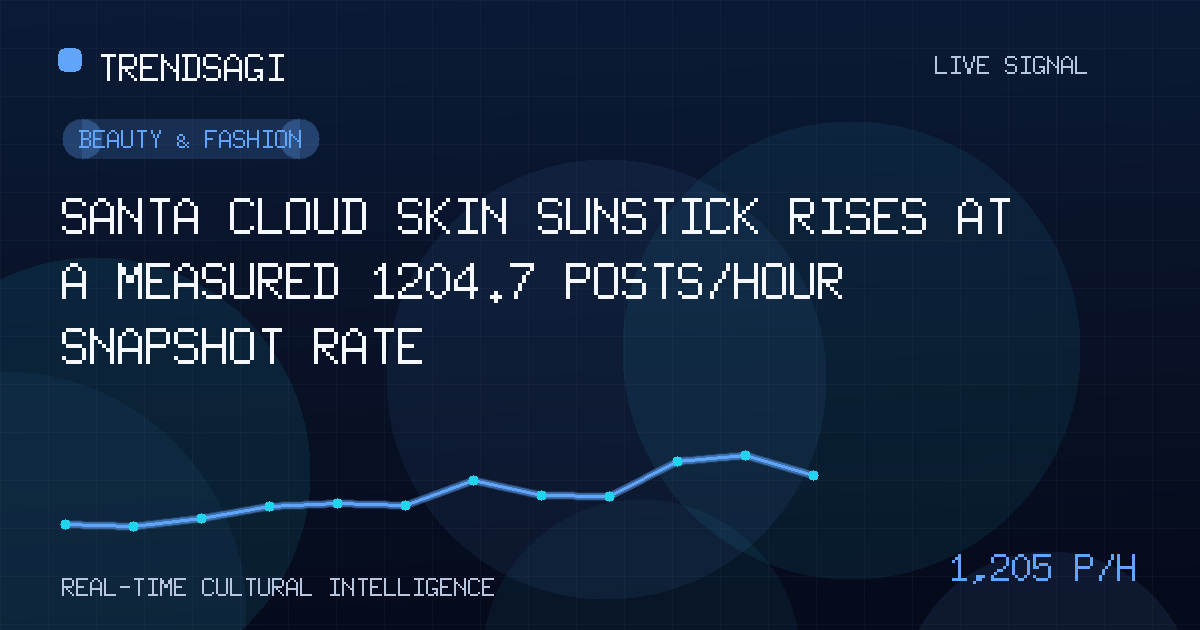
Santa Cloud Skin Sunstick logged 1714 posts with a measured 1204.7 posts/hour snapshot rate; the reason for the activity remains unverified.
Automated briefing. Generated from stored signal measurements and source-backed research; it is not manually reviewed. Read the methodology and limitations.
Metrics in this briefing are a snapshot associated with its publication date and may not reflect current conditions.
What changed
Santa Cloud Skin Sunstick registered increased posting activity in the stored observation, but no attributable public trigger has been verified. The defensible read is a measured burst worth investigating—not proof of a launch, promotion, viral event, sales lift, or rising consumer demand.
At 2026-10-08T06:56:50Z, the latest snapshot contained 1714 posts. The measured change was 1204.7 posts/hour over an exact 905-second window using 2 stored observations. This is a measured snapshot rate, not a live/current rate, forecast, reach, engagement, or unique-person count.
| Measure | Stored value |
|---|---|
| Observation time | 2026-10-08T06:56:50Z |
| Latest snapshot volume | 1714 posts |
| Measured snapshot rate | 1204.7 posts/hour |
| Exact measurement window | 905 seconds |
| Stored observations used | 2 |
Why this topic may be moving
The cause remains unclear because no attributable public trigger was verified for this briefing. The available record does not confirm an official announcement, retailer campaign, creator activation, news event, or episode of customer response. It would be speculative to label the movement as any one of those.
A concentrated increase can arise from several non-exclusive mechanisms:
- An official or retailer promotion, product notice, or restocking message.
- Creator-led tutorials, reviews, recommendations, or coordinated amplification.
- Customer questions about availability, pricing, ingredients, or use.
- Reposted, syndicated, or duplicated material that raises volume without equally raising independent authorship.
These are hypotheses to test, not findings about this topic. A causal explanation should be tied to dated source posts and, where possible, an official announcement or reputable reporting. Until that link is established, the signal shows elevated posting activity but not its motivation.
What the signal can and cannot establish
The signal is useful for timing and triage. It establishes that the monitored measure increased over the measured interval, that the latest snapshot contained 1714 posts at the stated time, and that the supplied pace was 1204.7 posts/hour.
- It does not identify a cause or the first post that triggered activity.
- It does not show whether the burst persisted beyond the observation window.
- It does not measure unique authors, audience reach, engagement, sentiment, or purchase intent.
- It does not establish geography, platform mix, language distribution, or whether posts were organic and independent.
- It does not demonstrate sales, product demand, inventory pressure, or a broader Beauty & Fashion trend.
Why it matters
The immediate value is deciding what to verify next, not making a commercial or editorial conclusion from one sharp interval.
- Beauty and fashion teams should compare the burst with their normal category baseline and prior product cycles before changing media or inventory plans.
- Retailers and customer-care teams should inspect the underlying posts for recurring availability, pricing, ingredient, application, or shipping questions, then verify those details against product records.
- Creators and community managers should locate the earliest attributable content and distinguish original discussion from reposts or brand-supplied material.
- Trend analysts should seek a longer series and a category comparison; a single product label can rise because of coordinated posting without the wider market changing.
What to watch next
The next useful evidence should be specific enough to test the simplest explanations:
- Persistence: collect another observation using the same 905-second window and counting method. A repeat rate can show whether the movement was sustained, while one isolated result leaves the cause open.
- Source concentration: identify which accounts and source types supplied the posts. Concentration on an official account, retailer, or creator network would support a different interpretation from broad independent discussion.
- Originality and spread: check for duplicate wording, linked reposts, and the mix of original posts. Also record geography and language so a regional burst is not mistaken for a global one.
- Attributable trigger: look for a dated official notice, product-page change, retailer event, or reputable report that aligns with the measured interval. Match timestamps before assigning causation.
- Conversation quality: classify a sample for questions, praise, criticism, tutorials, and commercial replies. This reveals what readers actually need without treating post volume as sentiment or sales.
- Independent demand checks: compare subsequent observations with category activity, verified availability, traffic, and transaction data. Those measures can corroborate commercial relevance, but none should be inferred from this signal alone.
A measured acceleration in posts is a reason to investigate, not a conclusion about consumer behavior. Repeated observations and attributable public evidence are needed before calling this a sustained trend or a campaign-driven event.
Methodology and limitations
The latest snapshot and change measurement are reproduced from the supplied record. The 1204.7 posts/hour figure is a measured snapshot rate derived from 2 stored observations across 905 seconds; it is not a live/current rate, forecast, reach, engagement, or unique-person count. Snapshot volume and rate answer different questions and should not be substituted for one another.
With only 2 observations and no longer baseline, the result is sensitive to where the interval starts and ends. No verified public event was tied to the interval, so the cause remains unclassified. The appropriate editorial label is elevated measured activity, pending further evidence.
Track This Topic for New Signals
Set alerts for future velocity or sentiment changes around this topic.
Explore Tracking PlansAbout TrendsAGI research
TrendsAGI's automated research pipeline publishes dated signal snapshots, methodology notes, and practical workflows for teams evaluating cultural momentum. Read how signals are scoped, scored, and limited in our research methodology.


