912-second window · 3 observations · Measured Oct 4, 2026, 7:56 AM UTC · Provider: go_recent_snapshot_v2
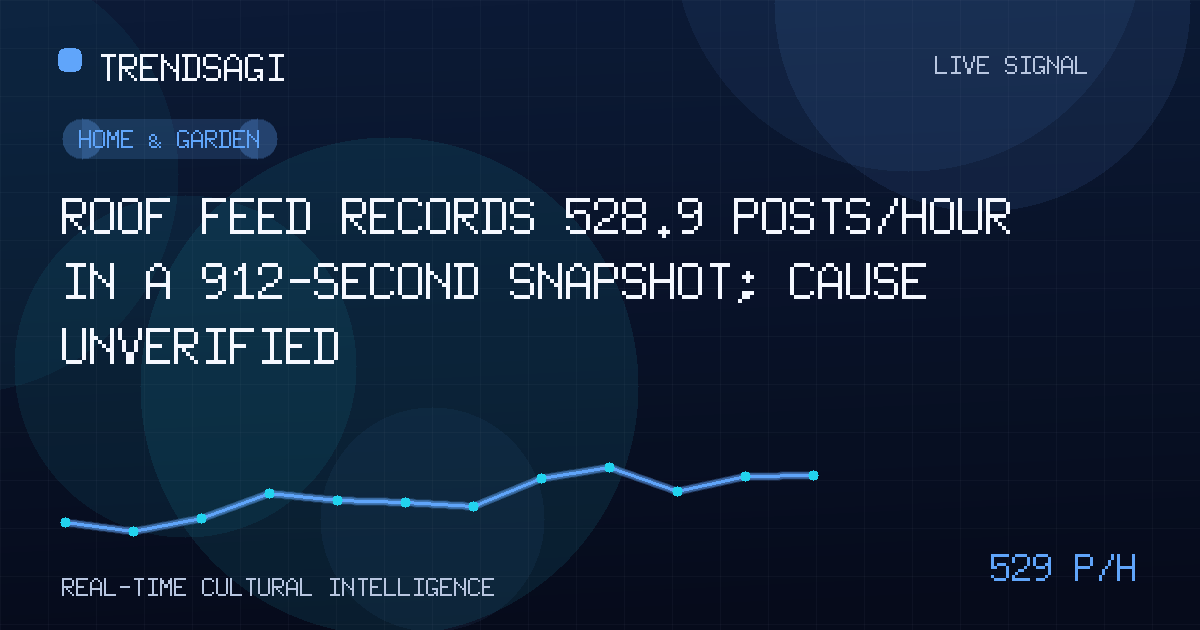
Roof feed records 528.9 posts/hour in a 912-second snapshot; cause unverified
Roof-related posts registered 528.9 posts/hour over a 912-second snapshot; the cause remains unverified, and these checks show what to verify next.
Automated briefing. Generated from stored signal measurements and source-backed research; it is not manually reviewed. Read the methodology and limitations.
Metrics in this briefing are a snapshot associated with its publication date and may not reflect current conditions.
What changed
The roof topic recorded a short-window burst in the available Home & Garden feed, but no specific public trigger has been verified. The defensible conclusion is that posting activity changed; a broader roofing event, market shift, or rise in homeowner demand has not been established.
The measured snapshot rate was 528.9 posts/hour over an exact 912-second window using 3 stored observations, measured at 2026-10-04T07:56:29Z. The latest snapshot volume was 423 posts. This is a measured snapshot rate, not a live or current rate, forecast, reach, engagement, or unique-person count.
| Measure | Observed value |
|---|---|
| Observation time | 2026-10-04T07:56:29Z |
| Measured snapshot rate | 528.9 posts/hour |
| Exact measurement window | 912 seconds |
| Stored observations | 3 |
| Latest snapshot volume | 423 posts |
Why this topic may be moving
No verified public context establishes why the topic moved. Weather, regulation, insurance changes, a product launch, seasonal project activity, or a highly shared post could produce discussion, but none should be treated as the cause here. The label also spans many kinds of roof-related content, so the feed may mix repairs, materials, safety, property, and commentary.
A measured rate answers how much posting activity appeared in this window, not what happened. A burst may reflect genuine public attention, but it may also be amplified by repetition or a narrow set of accounts. Without inspecting the underlying posts, those explanations cannot be separated.
The most useful causal checks are:
- Timing: Do posts cluster around one dated public event or announcement? An event should precede and explain the burst, not merely mention the same broad topic.
- Geography: Is discussion concentrated in one place or spread across unrelated regions? Concentration could indicate a local story, while broad spread may support wider attention, though not necessarily broader demand.
- Originality: How many posts are independent observations rather than reposts, reactions, or duplicate wording? This tests whether the rate represents many conversations or repeated circulation.
- Specificity: Do posts discuss the same roof issue, location, product, or project, or does the label simply collect loosely related uses of the word?
Until those checks find a matching public source, the cause remains unclear.
Why it matters
This signal matters because it identifies where attention should go next, not because it already explains the roof market. The appropriate response depends on the reader:
- Editors and public-information teams should check whether the burst corresponds to a verified event that residents need explained.
- Roofing businesses can inspect the posts for recurring questions or locations, but should not convert post volume into sales leads, project demand, or market size.
- Homeowners and property professionals can use the signal to decide which local roof issues merit checking, while relying on local authorities and qualified professionals for actual conditions.
- Researchers and analysts should preserve the signal as an observation, then test persistence, breadth, duplication, and content relevance before calling it a trend.
A high posting rate is evidence of activity in the observed feed, not proof of news importance, physical roof conditions, purchases, or a durable change in demand.
What to watch next
Five checks would turn this short-window observation into a more decision-useful signal:
- Inspect the underlying posts. Review the available items around the timestamp, record original versus reposted content, and identify repeated wording or shared source items. This helps distinguish conversation volume from recirculation.
- Measure the comparison baseline. Compare the 528.9 posts/hour snapshot with adjacent, non-overlapping windows collected through the same method. A one-window burst that does not persist is weaker evidence than repeated elevation.
- Split the topic. Group posts by geography, language, issue type, and evidence quality. Report each group separately rather than allowing a large local or repetitive cluster to look like broad interest.
- Verify a trigger on Google. Search for reporting or public notices published near 2026-10-04T07:56:29Z, then confirm the event’s date, location, and direct relevance to roofs. A causal account should align in both time and subject, not merely share a keyword.
- Seek independent confirmation. Check whether separate publishers or authoritative bodies describe the same development. If only the feed rises and no external context matches, the movement should remain unexplained rather than being forced into a narrative.
Concrete watch signals are:
- the measured rate remains elevated in later, separate windows;
- independent posts spread across multiple locations and roof-related subjects;
- a credible, time-matched source directly explains the discussion;
- reposts and duplicate wording fall as original discussion rises; and
- the signal disappears without corroboration, indicating a transient feed event.
Together, those signals would distinguish a durable information event from a brief spike. Persistence is especially important because 3 observations over 912 seconds can be sensitive to timing.
Methodology and limitations
The measurement timestamp is 2026-10-04T07:56:29Z. The 528.9 posts/hour figure comes from 3 stored observations across the exact 912-second window. The 423-post figure is the volume in the latest stored snapshot. Snapshot volume and the measured rate describe different things and are not interchangeable.
The signal does not provide a historical baseline, post-level sample, geography, language, sentiment, account uniqueness, engagement, or verified cause. It cannot show how many people were reached, whether a roof product was purchased, or whether physical roofing activity changed. The broad topic label may also capture loosely related language.
For now, the numbers should be reported exactly, 528.9 posts/hour should remain described as a measured snapshot rate, and the public cause should remain unverified until a contemporaneous source establishes the connection.
Track This Topic for New Signals
Set alerts for future velocity or sentiment changes around this topic.
Explore Tracking PlansAbout TrendsAGI research
TrendsAGI's automated research pipeline publishes dated signal snapshots, methodology notes, and practical workflows for teams evaluating cultural momentum. Read how signals are scoped, scored, and limited in our research methodology.


