898-second window · 3 observations · Measured Oct 9, 2026, 10:07 AM UTC · Provider: go_recent_snapshot_v2
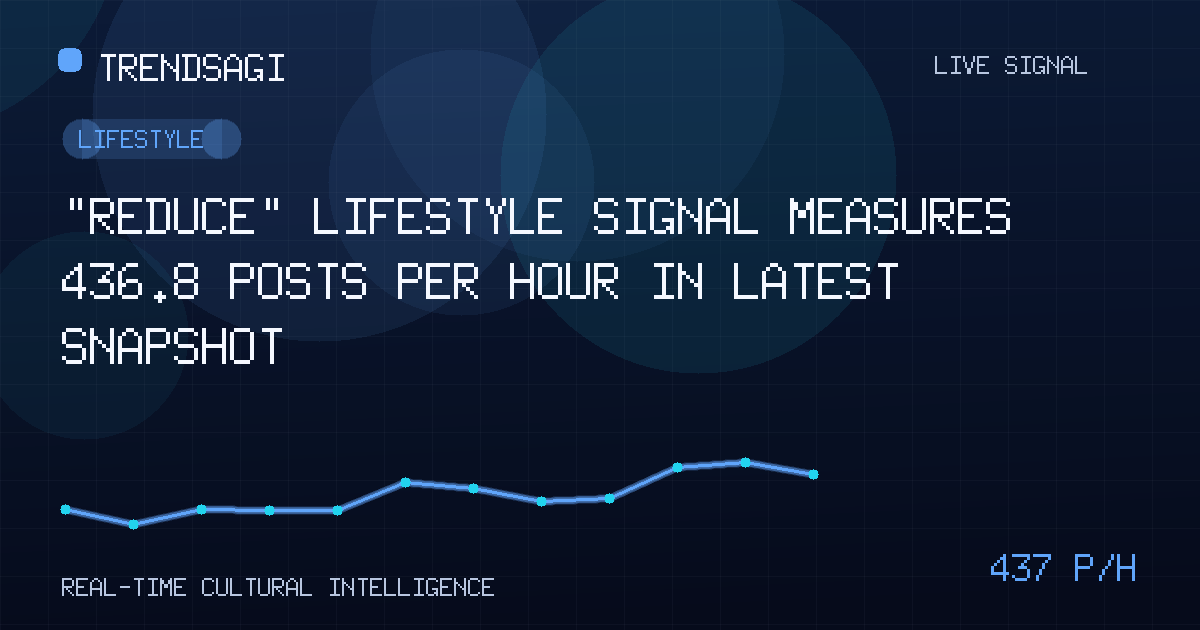
“Reduce” lifestyle signal measures 436.8 posts per hour in latest snapshot
The “Reduce” lifestyle signal measured 436.8 posts per hour over 898 seconds; its meaning, cause, and persistence need validation.
Automated briefing. Generated from stored signal measurements and source-backed research; it is not manually reviewed. Read the methodology and limitations.
Metrics in this briefing are a snapshot associated with its publication date and may not reflect current conditions.
What changed
The Lifestyle signal labeled “Reduce” registered a measured snapshot rate of 436.8 posts per hour at 2026-10-09T10:07:08Z. The direct answer is that the monitored label showed a concentrated flow of posts at that observation, but the signal does not identify one subject, campaign, or cultural shift behind the activity.
That rate was measured over an exact 898-second window using three stored observations; the latest snapshot contained 537 posts. These are different measures: 537 is the observed post count, while 436.8 posts per hour is the time-normalized snapshot rate. With no earlier baseline or verified trigger, the evidence supports further review—not a claim that the topic is growing, enduring, or reaching a particular audience.
| Observation time | Measured snapshot rate | Latest snapshot volume |
|---|---|---|
| 2026-10-09T10:07:08Z | 436.8 posts per hour | 537 posts |
What the signal establishes
The useful conclusion is narrow but actionable: the stored Lifestyle signal labeled “Reduce” warrants inspection. Its category supplies broad editorial context, but the label does not say whether posts concern reducing consumption, waste, screen time, spending, emissions, physical effort, or something else entirely. Without excerpts, matching rules, geography, platform mix, or account data, even the apparent subject remains uncertain.
A measured posting rate can identify where to look, but without matched text and a baseline it cannot explain what changed or establish that a durable trend has formed.
The timestamp establishes when the latest collection was observed, and the rate establishes the pace recorded across the supplied window. Neither tells us who posted, whether one account posted repeatedly, how many people participated, or whether the content was original. The 537-post volume likewise says nothing by itself about engagement, sentiment, location, or impact.
Why this topic may be moving
No verified public reporting is available to explain this cluster, so no news event, announcement, or seasonal development can responsibly be offered as its cause. The cause remains unclear. Several mechanisms could produce the observed pace, but each is a hypothesis that requires testing rather than a finding:
- Semantic overlap. “Reduce” may collect unrelated uses of a common word, making several conversations look like one focused trend.
- A shared prompt. Creators, publishers, campaigns, or community discussions may have used the word in a common framing, although no such source is identified here.
- Platform or seasonal effects. A platform feature, recurring season, or scheduled content cycle could increase posting without representing a new underlying behavior.
- Repetition. Synced posts, reused media, automated accounts, or duplicate submissions could inflate volume; the available figures cannot distinguish these cases.
Testing those possibilities requires access to the underlying posts and their timing. Counting the label more rapidly would not answer them.
Why it matters
Trend editors and lifestyle publishers should care because a broad label can combine several stories that deserve separate treatment. Before producing an explainer, comparing products, or declaring a behavior shift, they need to know what users meant by “reduce.” A taxonomy based on actual post language would prevent one prominent use from being generalized to the entire cluster.
Researchers and audience teams should also distinguish volume from human attention. The measured posts-per-hour figure can help allocate review time, but it is not a proxy for unique participants, engagement, sentiment, or reach. For readers, the signal’s practical value is therefore a queue for verification: it points to a place to look, not a conclusion to repeat.
Teams using the signal for editorial or planning purposes should withhold a durable-trend conclusion until the label resolves into coherent themes and shows sustained activity relative to a matched baseline.
What to watch next
The next step is a compact validation pass:
- Audit the sample. Review a representative slice of raw posts, including the earliest and latest records, and retain the exact matching rule used to assign “Reduce.”
- Classify intent. Group posts by their object of reduction and by whether they express personal intent, report an event, promote a solution, or merely use the word incidentally.
- Check duplication. Compare identical text, media, links, near-duplicate phrases, timestamps, and coordinated posting patterns. Report original content separately from total volume.
- Establish context. Map the leading sources, platforms, locations, languages, and audience segments. Determine whether activity is concentrated in one community or broadly distributed.
- Find a cause. Check whether a dated, verifiable public event or campaign aligns with the first increase. Attribute any external claim to the identifiable publisher that reported it.
- Compare fairly. Calculate comparable snapshot rates across matched time windows and a historical baseline rather than treating this observation as a permanent level.
Concrete watch signals are persistence above the eventual baseline, concentration around one clearly defined meaning, growth in original posts from distinct sources rather than repeated copies, corroboration across independent platforms or datasets, and verifiable references to an event. A one-window cluster followed by lower activity would instead look more like a spike or short-lived burst.
Methodology and limitations
This briefing uses the supplied figures: the 2026-10-09T10:07:08Z observation, a latest snapshot volume of 537 posts, a measured snapshot rate of 436.8 posts per hour, and a measurement based on three stored observations across an exact 898-second window. The posts-per-hour value is not a live or current rate, and it is not a forecast. The snapshot volume is not a rate. Neither figure measures unique people, engagement, reach, sentiment, or commercial effect.
Most importantly, this is an unclassified one-word signal. It establishes that the monitored label registered the reported volume at the reported pace; it cannot establish what “Reduce” means, why the volume moved, or whether the movement represents changing real-world behavior. Those limits are the central finding and define what must be verified next.
Track This Topic for New Signals
Set alerts for future velocity or sentiment changes around this topic.
Explore Tracking PlansAbout TrendsAGI research
TrendsAGI's automated research pipeline publishes dated signal snapshots, methodology notes, and practical workflows for teams evaluating cultural momentum. Read how signals are scoped, scored, and limited in our research methodology.


