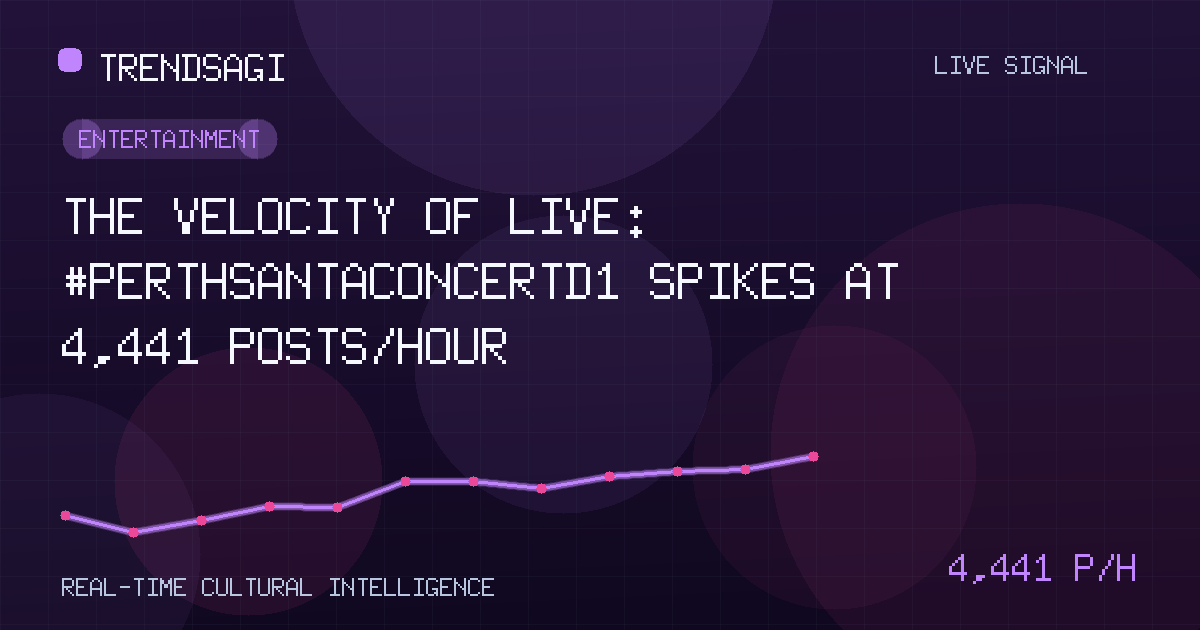
The Velocity of Live: #PerthSantaConcertD1 Spikes at 4,441 Posts/Hour
A data briefing analyzing the 4,441 posts/hour spike for #PerthSantaConcertD1. Observed data, plausible drivers, key audiences, and future signals to watch.
Automated briefing. Generated from stored signal measurements and source-backed research; it is not manually reviewed. Read the methodology and limitations.
Metrics in this briefing are a snapshot associated with its publication date and may not reflect current conditions.
TL;DR
- A major social media surge is currently underway for
#PerthSantaConcertD1. - TrendsAGI sensors have measured a mention rate of 4,441 posts per hour, with a total snapshot volume of 9,000 mentions.
- The velocity-to-volume ratio strongly indicates a live, real-time event driving a synchronized social response.
- The dataset currently points to a highly engaged audience reacting to a specific moment within Day 1 of a larger Perth-based festive concert series.
- Stakeholders should monitor sentiment, volume decay rate, and the emergence of a
#PerthSantaConcertD2conversation for deeper strategic insights.
Data Snapshot: A Velocity Spike in Real Time
The raw data reveals a sharp upward inflection for the #PerthSantaConcertD1 hashtag. The current measured mention rate is exactly 4,441.0 posts per hour, derived from recent snapshot calculations. Against this rate, the latest cumulative snapshot volume stands at 9,000 mentions. This specific data signature—a high velocity paired with a moderate total volume—is mathematically consistent with a conversation that began approximately 2 hours ago and is currently in a peak or near-peak phase.
The velocity-to-volume ratio of 4,441 posts/hr against 9,000 total mentions indicates a live audience responding together in real-time, not a slow-burn viral spread.
This data serves as the observed foundation. All further analysis is framed as plausible interpretation against this hard measurement.
Plausible Drivers of the Surge
Interpretation of the Hashtag Structure
The nomenclature is highly instructive. 'Perth' anchors the conversation geographically to Western Australia's capital. 'Santa' and 'Concert' clearly suggest a festive Christmas-themed music event. The 'D1' suffix is a strong structural signal that this is a multi-day or multi-installment series, with Day 1 currently occupying the attention of the audience.
Hypotheses for the Spike
Given the live-spike profile, we can hypothesize several potential triggers, though we cannot confirm them without direct access to post content:
- A scheduled main performance or finale reaching its climax.
- A surprise guest or announcement made during the concert.
- A highly shareable visual moment (e.g., fireworks, light show) that encouraged immediate posting.
- Technical difficulties that spurred a massive group response.
The data cannot distinguish between these specific triggers, but the synchronized reaction pattern is definitive. The audience is clearly co-experiencing a significant moment in real-time.
Who This Matters To
This trend has direct implications for several specific groups:
- Event Organizers and Producers: The data provides a real-time KPI for audience engagement and reach. It benchmarks the success of this Day 1 activation against internal goals or past similar events.
- Local Media and Newsrooms (Perth): The spike represents a verified, measurable interest in the community. It offers a data-driven angle for reporting on the success or virality of the event.
- Sponsors and Advertisers: The significant user-generated content output represents high levels of brand exposure for any associated sponsors. The sentiment analysis of this mention pool will be a crucial next metric.
- Community Attendees: The spike signifies a collective community experience. It represents the digital extension of the physical event, enhancing its cultural footprint.
Specific Signals to Watch Next
To understand whether this is a momentary spike driven by a specific broadcast moment or the beginning of a sustained trend, analysts should watch these specific data signals:
1. Volume Deceleration Rate
Monitor how quickly the mention rate drops after the anticipated end of the concert session. A sharp drop confirms a live event decay. A gradual drop suggests people are continuing to share user-generated content, building a longer tail for the trend.
2. Sentiment Polarity
The current velocity tells us about engagement volume, not quality. A deeper dive into the sentiment of the 9,000 mentions is critical. Highly positive sentiment reinforces the event’s success; highly mixed sentiment might indicate controversy or technical issues.
3. The 'D2' Window
A key structural prediction based on the 'D1' label is the emergence of #PerthSantaConcertD2. The volume of Day 1’s conversation will likely set the baseline for Day 2. A significant increase in the D2 mention rate would signal word-of-mouth driving higher attendance or social participation.
4. Cross-Platform Correlation
This TrendsAGI snapshot captures a specific slice of the social web. Correlating this spike with data from visual platforms (like Instagram or TikTok) regarding the same event would provide a holistic view of the audience's multi-platform reaction.
Track This Topic for New Signals
Set alerts for future velocity or sentiment changes around this topic.
Explore Tracking PlansAbout TrendsAGI research
TrendsAGI's automated research pipeline publishes dated signal snapshots, methodology notes, and practical workflows for teams evaluating cultural momentum. Read how signals are scoped, scored, and limited in our research methodology.