863-second window · 3 observations · Measured Sep 25, 2026, 10:55 PM UTC · Provider: go_recent_snapshot_v2
Nor'easter signal records a measured 2239.5 posts/hour over an 863-second window
Nor'easter activity shows 2239.5 posts/hour over 863 seconds; what the snapshot establishes, what remains unclear, and what to verify next.
Automated briefing. Generated from stored signal measurements and source-backed research; it is not manually reviewed. Read the methodology and limitations.
Metrics in this briefing are a snapshot associated with its publication date and may not reflect current conditions.
What changed
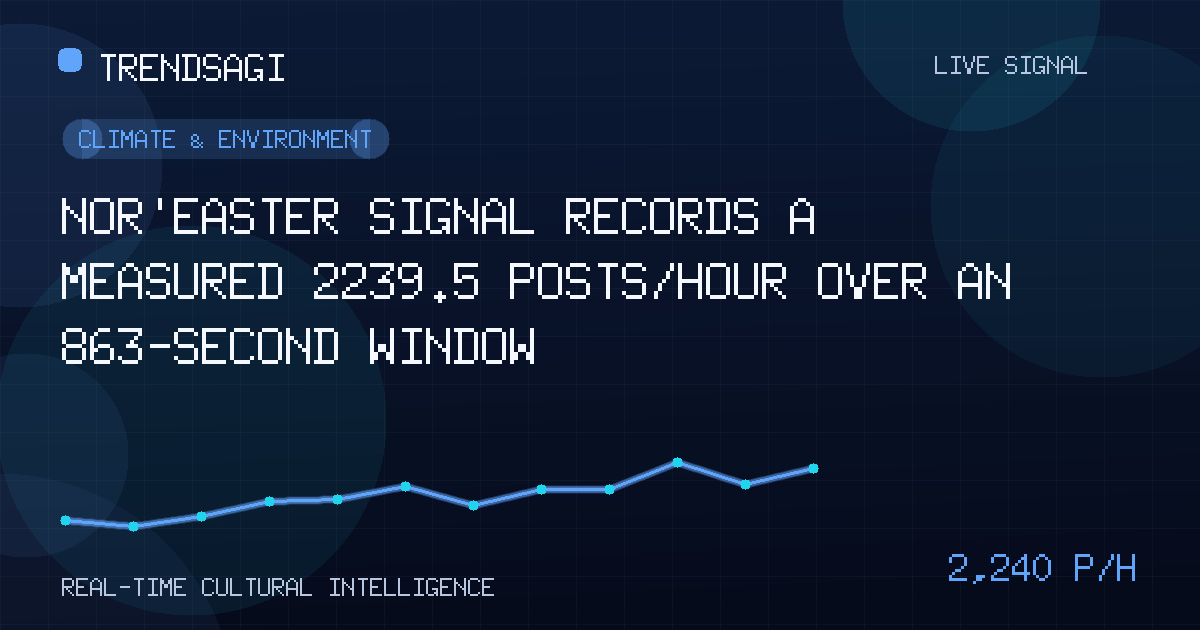
Nor'easter discussion accelerated in the stored signal, but its cause remains unverified. The latest stored observation at 2026-09-25T22:55:31Z contains 900 posts. Across an exact 863-second window using 3 stored observations, the measured change rate was 2239.5 posts/hour. The direct read is that posting under this label intensified during the measured interval; the record does not identify a specific weather system, location, or trigger.
The 2239.5 figure is a measured snapshot rate, not a live or current rate, forecast, reach, engagement, or unique-person count. The 900 figure is snapshot volume, not a count of authors or a rate. For a real reader, the useful conclusion is narrow: posting under the label increased within this short observation window and warrants verification, not an unqualified claim about weather danger.
| Measure | Value |
|---|---|
| Observation time | 2026-09-25T22:55:31Z |
| Measured snapshot rate | 2239.5 posts/hour |
| Snapshot volume | 900 posts |
Why this topic may be moving
No verified public context is available to establish why the topic is moving. The stored category is Climate & Environment, but the record provides no event summary and does not tie the label to a forecast, official advisory, affected place, or service interruption. Any assertion that one of those caused the increase would be speculation.
Possible explanations include newly published weather information, changing local conditions, disruption-related coverage, local reporting, historical discussion, or broad use of the term. None is confirmed here. A short spike can also reflect reposting, duplicate circulation, changes in collection, or a label being used outside a current weather event. These possibilities should guide verification rather than be reported as facts.
What the signal can and cannot establish
The positive findings are narrow:
- Observed volume: 900 posts were present in the latest stored snapshot.
- Measured change: 3 observations recorded a rate of 2239.5 posts/hour over an exact 863-second window.
- Comparison point: The timestamped snapshot provides a reference for comparing later activity with potential public developments.
The signal does not establish:
- Cause: There is no verified explanation for the increase.
- Place: No geography or local concentration can be determined.
- Participation: The record does not provide unique-author counts or evidence about coordinated behavior.
- Content: It does not establish sentiment, accuracy, originality, or duplication.
- Consequences: It does not confirm hazardous conditions, operational disruptions, or how the rate compares with normal activity.
Why it matters
A rapid social signal is most useful as a routing cue. It can tell editors and monitoring teams where to look first and that public attention is forming around a label. It cannot tell them what happened. That distinction matters because a high-volume conversation may reflect useful early awareness, repeated content, label ambiguity, or an unrelated use of the word.
- Local reporters and public-information teams should use the signal to prioritize a verification search, then attribute any confirmed explanation to the publisher that establishes it.
- Residents in any potentially affected area should use confirmed local weather and emergency information for decisions, not a social-volume measure.
- Transport, utility, and event teams should look for independently verified operational effects before changing plans.
- Researchers should treat the label as an attention proxy until its geography, meaning, and source composition are known.
A social spike can justify a faster verification check; it cannot, by itself, identify the weather event or establish that conditions are dangerous.
What to watch next
- Find the earliest credible trigger. Check public search results and publisher pages around the observation time, prioritizing official weather or emergency releases and local reporting. Compare publication times with 2026-09-25T22:55:31Z because later coverage may explain the spread rather than cause it.
- Pin down what the label denotes. Look for a named location, weather system, forecast discussion, historical reference, or non-weather use. Do not assume that every post concerns current conditions.
- Test persistence. Collect later stored snapshots and calculate separate measured windows. Do not carry 2239.5 posts/hour forward as a live baseline.
- Audit the composition of the posts. Where data permits, distinguish unique accounts from duplicates, original posts from recirculation, official sources from commentary, and attention from engagement.
- Verify real-world effects separately. Look for confirmed weather conditions, advisories, travel changes, service interruptions, or other consequences. Conversation volume is not a substitute for those checks.
Concrete watch signals
- Additional measured windows at or above 2239.5 posts/hour would show that the initial pace persisted or intensified.
- A credible public update that predates or aligns with the observation would provide a testable explanation.
- Posts would become more useful if they converged on consistent, verifiable locations and conditions rather than the label alone.
- Operational reports would matter if credible sources confirmed closures, travel changes, power issues, or similar effects.
- A falling posting rate alongside continued verified impact reporting would suggest a shift from initial attention to aftermath.
Methodology and limitations
The reported 2239.5 posts/hour was measured from 3 stored observations over an exact 863-second window and is presented as a measured snapshot rate. The separate figure of 900 posts is the volume in the latest stored snapshot. Neither number is a live rate, forecast, reach measure, engagement total, or unique-person count.
No baseline, platform coverage, query definition, post-level content, geography, account data, source mix, or duplicate controls are provided. Those omissions prevent conclusions about relative activity, authenticity, sentiment, causality, and real-world consequences. The Climate & Environment category also does not verify that a meteorological event occurred. Because no verified public trigger is available, the cause remains unclear. Use this signal to prioritize checking, not as stand-alone evidence of a weather hazard.
Track This Topic for New Signals
Set alerts for future velocity or sentiment changes around this topic.
Explore Tracking PlansAbout TrendsAGI research
TrendsAGI's automated research pipeline publishes dated signal snapshots, methodology notes, and practical workflows for teams evaluating cultural momentum. Read how signals are scoped, scored, and limited in our research methodology.


