1816-second window · 3 observations · Measured Sep 27, 2026, 9:56 AM UTC · Provider: go_recent_snapshot_v2
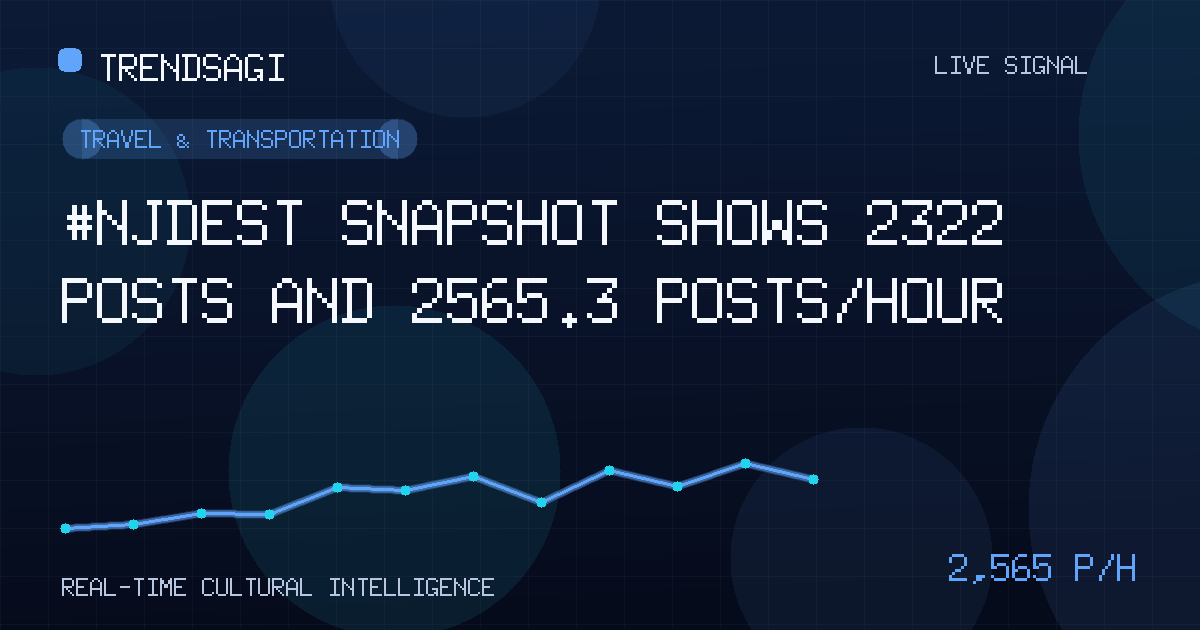
#njdest snapshot shows 2322 posts and 2565.3 posts/hour
The #njdest snapshot held 2322 posts and a 2565.3 posts/hour measured rate; public verification has not established why activity moved.
Automated briefing. Generated from stored signal measurements and source-backed research; it is not manually reviewed. Read the methodology and limitations.
Metrics in this briefing are a snapshot associated with its publication date and may not reflect current conditions.
What changed
The direct answer is that #njdest registered 2322 posts in the latest stored snapshot and a measured change rate of 2565.3 posts/hour at the observation time. That establishes active movement in the monitored sample, but no public trigger could be independently verified for this briefing, so the cause remains unresolved.
The 2565.3 posts/hour figure is a measured snapshot rate over an exact 1816-second window using 3 stored observations. It is not a live or current rate, forecast, reach estimate, engagement metric, or unique-person count. Likewise, 2322 is the latest snapshot volume, not a rate; the two measures should be reported separately.
| Measure | Stored value |
|---|---|
| Observation time | 2026-09-27T09:56:42Z |
| Measured snapshot rate | 2565.3 posts/hour |
| Snapshot volume | 2322 posts |
Taken together, these values confirm posting throughput during the sampled interval. They do not show how the rate compares with a normal baseline, whether the posts represent distinct conversations, or whether the activity continued after the observation.
Why this topic may be moving
No public trigger could be independently verified for this briefing. The stored record supplies the hashtag label, an Other category, and no signal description, but it does not provide a source post, event, platform, collection scope, or confirmed expansion of #njdest. It would be unsafe to assume that the label refers to New Jersey, tourism, or a particular organization.
Several explanations remain testable rather than established:
- A scheduled event, announcement, publication, or controversy may have prompted discussion.
- A campaign, creator network, or coordinated re-sharing pattern may have amplified an original message.
- Platform discovery or moderation changes may have altered how often matching posts were surfaced.
- The query may be ambiguous, causing unrelated conversations to be grouped under the same label.
- A collection or classification change could be affecting the measured throughput.
These are hypotheses for follow-up, not verified reasons.
A measured posting rate can show that messages are being added quickly without showing why they are being posted. Until the underlying posts and a public trigger are checked, the defensible conclusion is activity, not causation.
Why it matters
Teams responsible for local information, travel, events, communications, or brand monitoring may need to investigate the signal if the post content confirms that it concerns their subject. A fast-moving conversation can affect verification queues, customer-service preparation, and editorial coverage. However, the aggregate measurement alone cannot tell those teams whether the activity is relevant, credible, organic, or geographically concentrated.
Newsrooms and fact-checkers should treat the signal as a prompt to inspect original posts, not evidence of a developing story. Platform trust and brand-safety teams may also need duplicate and coordination checks. General readers should not interpret 2322 posts as public consensus, popularity, or evidence that 2322 different people participated.
What the signal can—and cannot—establish
The stored signal can establish the observation time, the volume present in the snapshot, and the measured posting rate over the stated window. That is enough to prioritize collection and indicate where a closer content review could add value.
- It does not establish why the topic moved.
- It does not reveal the number of unique posters or people.
- It does not measure sentiment, factual accuracy, or support for a position.
- It does not confirm geography, language, audience demographics, or platform scope.
- It does not distinguish original discussion from duplicate, automated, or coordinated posting.
- It does not show whether the movement was unusually high for this topic.
- It does not establish that the activity persisted beyond the snapshot.
What to watch next
The most useful next step is not another headline based on volume alone, but a comparable collection designed to explain the signal:
- Keep the measurement comparable. Use the same hashtag query, collection method, observation cadence, and exact reporting window for subsequent snapshots. Compare both volume and measured rate rather than treating either as a substitute for the other.
- Inspect the underlying posts. Review a time-ordered sample and separate original posts from exact duplicates, near-duplicates, quotations, and re-shares. This is necessary before estimating how broadly the topic was discussed.
- Check concentration. Examine the distribution of distinct accounts, repeated wording, shared links, and synchronized bursts. Concentration may indicate coordination, but it should not be labeled automation without additional evidence.
- Resolve what the label means. Manually classify a sample by topic, geography, language, and relevance. Do not expand #njdest or assign it to a community without supporting post-level evidence.
- Test candidate public causes. Look for a verifiable announcement, event, publication, or controversy and compare its timestamp with the start of the posting burst. Any confirmed external fact should be attributed to the publisher that established it.
- Measure persistence. Continue collecting until subsequent evidence shows either a return toward a comparable baseline or a sustained change that requires a different explanation.
Concrete watch signals
- Persistent activity: later comparable snapshots remain near the measured 2565.3 posts/hour rate rather than showing an immediate retreat.
- Broader participation: activity continues after exact duplicates and repeated re-shares are separated, with relevant posts distributed across more distinct accounts.
- Coordination risk: a small concentration of accounts repeatedly publishes similar text or the same link in tightly grouped bursts.
- Stronger causal support: posts repeatedly reference a verifiable public development, and its publication time clearly precedes the increase.
- Query drift: the apparent meaning of #njdest changes across sampled posts, indicating that one trend label may be combining separate conversations.
Methodology and limitations
The canonical observation was stored at 2026-09-27T09:56:42Z. The reported 2565.3 posts/hour value comes from 3 stored observations across an exact 1816-second window. It is reproduced as a measured snapshot rate rather than recalculated, converted, or presented as a live count.
The available record does not state the platform, collection scope, historical baseline, post-level sample, duplicate controls, or geographic and language filters. Those omissions limit comparisons, causal interpretation, and claims about unique participation. Because no public trigger could be verified, the current finding is limited to observed posting activity. The signal is useful for triage and further investigation, but it is not yet an explanation of what happened.
Track This Topic for New Signals
Set alerts for future velocity or sentiment changes around this topic.
Explore Tracking PlansAbout TrendsAGI research
TrendsAGI's automated research pipeline publishes dated signal snapshots, methodology notes, and practical workflows for teams evaluating cultural momentum. Read how signals are scoped, scored, and limited in our research methodology.


