1798-second window · 2 observations · Measured Sep 25, 2026, 1:22 AM UTC · Provider: go_recent_snapshot_v2
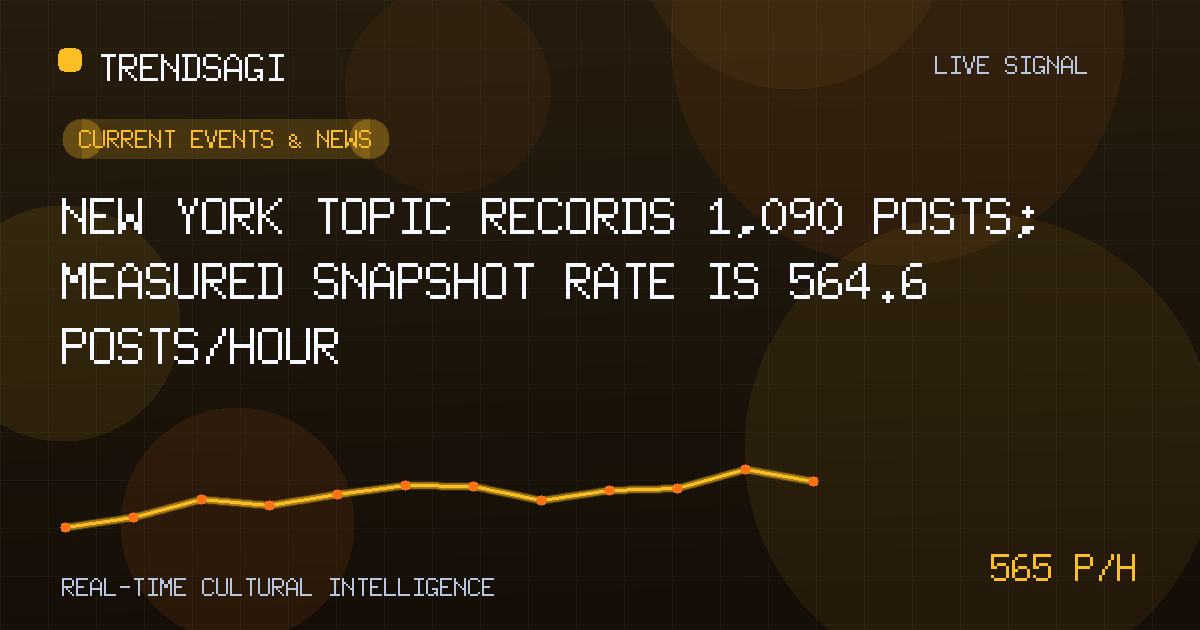
New York topic records 1,090 posts; measured snapshot rate is 564.6 posts/hour
New York’s latest snapshot holds 1,090 posts, with a measured 564.6 posts/hour; the catalyst still needs verification.
Automated briefing. Generated from stored signal measurements and source-backed research; it is not manually reviewed. Read the methodology and limitations.
Metrics in this briefing are a snapshot associated with its publication date and may not reflect current conditions.
What changed
New York is showing a pronounced rise in recorded post activity. The latest snapshot contains 1,090 posts, while the measured snapshot rate is 564.6 posts/hour. The available record contains no verified event explanation, so the defensible conclusion is that posting accelerated—not that a particular news event has been established as the cause.
The 564.6 posts/hour figure is a measured snapshot rate based on two stored observations over an exact 1,798-second window ending at 2026-09-25T01:22:09Z. It is not a live or current rate, forecast, reach figure, engagement measure, or unique-person count. The 1,090 figure is the volume in the latest snapshot, not a rate. This short comparison also cannot establish whether the increase will persist.
| Observation time | 2026-09-25T01:22:09Z |
|---|---|
| Measured posts/hour | 564.6 |
| Latest snapshot volume | 1,090 posts |
Why this topic may be moving
The strongest supported explanation is simply that posts carrying the New York label accumulated more quickly during the recorded comparison. The observations do not distinguish between a city-specific development, a state-level story, or a broader news event that mentioned New York. The topic label is broad, and the record does not establish that participants were located in New York or were discussing local conditions exclusively.
No verified public context accompanies the observations, so no news event, organization, or policy should be named as the catalyst. A plausible story is not enough to explain the movement. A useful attribution would require dated public reporting or an official statement connected to both the observed activity and the relevant meaning of “New York.” Without that connection, assigning a cause would be speculation.
Volume can also increase without representing broad participation. Repeated circulation of one announcement, coordinated posting, or renewed discussion of an existing issue can raise the count without adding equivalent information. The available figures do not show whether any of these mechanisms occurred; they identify a change in pace, not its mechanism.
The signal establishes that the recorded pace increased. It does not establish which event caused the increase, whether the participants are local, or whether the pattern will survive the next comparable observation.
Why it matters
For readers, the signal is a prompt to check New York-related coverage before repetition turns an unconfirmed explanation into a settled narrative. It supports prioritization, not automatic prominence. Faster-moving conversations can create pressure to publish quickly, making verification and precise geographic labeling especially important.
Different audiences should interpret the measurement differently. New York residents may use it to identify subjects receiving renewed attention. Local officials and public agencies should not treat post volume as a count of constituents or a measure of public approval. Newsrooms should examine the underlying claims rather than infer accuracy from activity. Researchers need post-level evidence before drawing conclusions about sentiment or representativeness.
Businesses and civic organizations should also avoid treating this online measure as evidence of foot traffic, demand, or agreement. Online posting and real-world behavior may move together, but the observations do not establish that relationship. The practical value of the signal is therefore narrower: it identifies where verification is most urgent.
What to watch next
- Inspect what the posts contain. Review a representative sample of the 1,090 posts, recording publication time, source type, whether an item is original or reposted, its stated geographic connection, and any named event. This would help determine whether the activity is broad or concentrated and what “New York” means in practice.
- Match a catalyst with dated evidence. Check established reporting and relevant official statements for developments connected to the observed window. Require a defensible connection in both timing and subject. A story published afterward does not prove that it drove earlier activity, and a story merely set in New York may not explain the label.
- Track another comparable window. Keep the topic definition and counting method stable, then record the next snapshot and its comparison interval. A new measured rate can be compared with 564.6 posts/hour to assess persistence, reversal, or further acceleration. Another short observation would still not establish a durable long-term trend.
- Separate volume from substantive impact. Look for original reporting, distinct sources, concrete effects, and new information from authoritative public sources. Increasing volume may reflect repetition rather than wider participation. Evidence of real-world impact should be assessed independently of the post count.
- Hold a clear attribution threshold. Name a specific catalyst only when verified public context and the post sample point toward the same development. If the evidence conflicts or remains inconclusive, report the cause as unresolved rather than selecting the most dramatic explanation.
Methodology and limitations
This briefing uses two stored observations for the New York topic within the Current Events & News category. The latest observation, recorded at 2026-09-25T01:22:09Z, contains 1,090 posts. The supplied 564.6 posts/hour measurement describes the change over the exact 1,798-second comparison window. It is a measured snapshot rate, not a live rate, forecast, reach estimate, engagement measure, or count of unique people.
Two observations provide limited basis for assessing duration. The comparison does not reveal the earlier post count, establish a typical baseline, or show whether activity returned to its previous pace. The topic label and category do not establish geographic origin, sentiment, factual reliability, or the importance of the underlying issue. Snapshot volume counts recorded posts; it does not measure how many people saw, understood, or acted on them.
No external catalyst has been verified for this briefing. Accordingly, the analysis can establish increased recorded posting activity and identify useful verification steps, but it cannot responsibly establish which event caused the movement or whether the signal represents a sustained change in New York-related attention.
Track This Topic for New Signals
Set alerts for future velocity or sentiment changes around this topic.
Explore Tracking PlansAbout TrendsAGI research
TrendsAGI's automated research pipeline publishes dated signal snapshots, methodology notes, and practical workflows for teams evaluating cultural momentum. Read how signals are scoped, scored, and limited in our research methodology.


