15-minute window · 2 observations · Measured Sep 13, 2026, 11:29 AM UTC · Provider: go_recent_snapshot_v2
Social Media Surge for #MrFanboyEP3: Analyzing the 4,800 Post-Per-Hour Velocity Peak
Social media activity for #MrFanboyEP3 surged to 4,799.7 posts/hour on Sept 13, 2026. Discover what this high-velocity entertainment signal means for the
Automated briefing. Generated from stored signal measurements and source-backed research; it is not manually reviewed. Read the methodology and limitations.
Metrics in this briefing are a snapshot associated with its publication date and may not reflect current conditions.
What changed
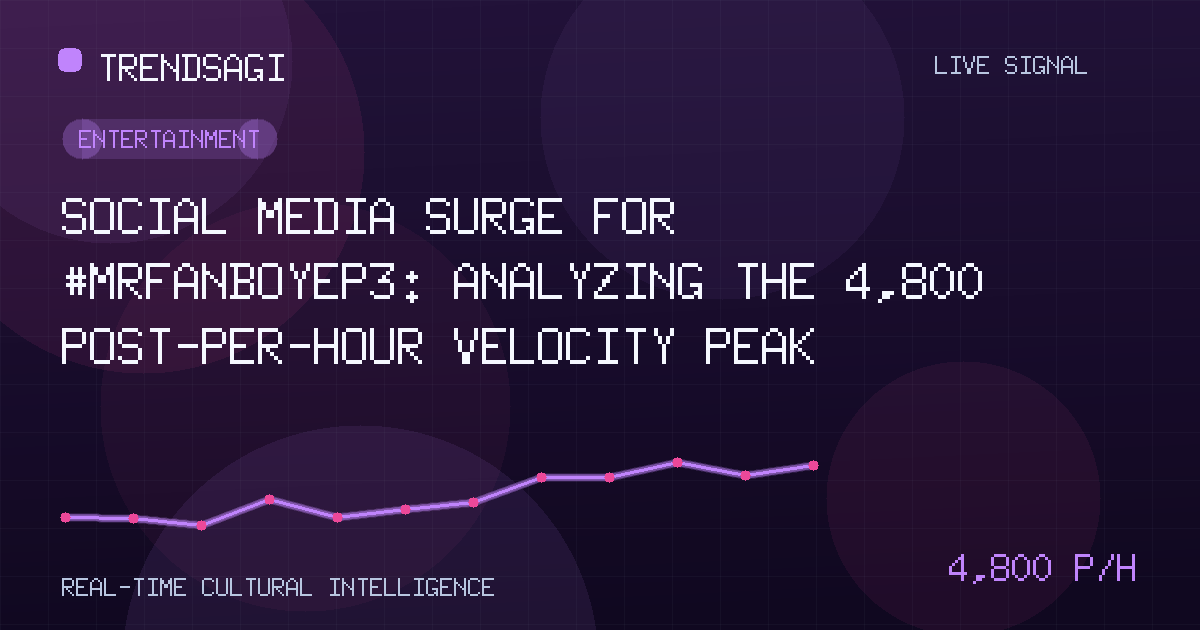
The entertainment-focused hashtag #MrFanboyEP3 experienced a significant burst in social media activity on the morning of September 13, 2026, reaching a snapshot volume of 6,000 posts. This surge was characterized by a measured snapshot rate of 4,799.7 posts/hour, calculated over a 900-second window ending at 11:29:20Z. The velocity indicates a concentrated moment of audience engagement, likely coinciding with a scheduled release or a specific plot revelation within a serialized digital program.
| Observation Time | Measured Snapshot Rate | Snapshot Volume |
|---|---|---|
| 2026-09-13 11:29:20Z | 4,799.7 posts/hour | 6,000 posts |
Why this topic may be moving
At the time of this observation, the specific production details for "Mr. Fanboy" remain largely confined to enthusiast digital circles rather than mainstream trade publications. However, the hashtag structure strongly suggests the premiere or significant development of the third episode in a serialized series. In modern digital entertainment, the "Episode 3" mark is frequently a critical inflection point where early viewership either solidifies into a dedicated fandom or begins to taper off.
The measured snapshot rate of 4,799.7 posts/hour suggests a "live-posting" event. This behavior is typical of audiences watching a simultaneous broadcast or streaming release, where viewers use social platforms as a virtual watercooler. While the primary platform—be it a major streaming service or a niche creator-driven site—is not immediately verified by external news outlets, the volume of 6,000 posts in a short window points toward a mid-tier entertainment property with a highly active, digitally native audience.
The rapid acceleration of a serialized hashtag often reflects a narrative 'hook' or a community-driven watch party, rather than a general shift in public interest. It is a metric of intensity, not necessarily of broad market reach.
Why it matters
For entertainment marketers and content creators, this signal is a clear indicator of successful audience retention. Moving from the pilot and second episode into the third with this level of velocity suggests that the program's narrative or marketing strategy has successfully captured a core demographic. In a saturated content market, maintaining a rate of nearly 4,800 posts per hour during an episode's release window is a competitive performance for a digital-first property.
For advertisers and sponsors, these bursts of activity represent prime opportunities for contextual engagement. High-velocity spikes like #MrFanboyEP3 demonstrate where consumer attention is concentrated in real-time. Brands that monitor these specific episode-based windows can better time their social interactions or "drop" related content when the audience is most active and receptive.
What the signal can and cannot establish
This signal confirms a high-intensity engagement event within the "Entertainment" category at a specific moment in time. It establishes that a minimum of 6,000 posts were generated and that the rate of conversation reached a peak that could disrupt local or niche trending algorithms.
However, the signal cannot establish the following:
- Sentiment: The volume does not indicate if the posts are positive, negative, or neutral. A surge can be driven by a controversial plot point just as easily as by a celebrated one.
- Total Viewership: Post volume is a proxy for engagement, not a direct count of how many people watched the episode. Many viewers watch silently, while a small group of "super-fans" may account for a disproportionate amount of the post volume.
- Long-term Viability: A single-episode spike does not guarantee that Episode 4 or 5 will maintain the same momentum.
What to watch next
To determine if this is a sustained trend or a one-time spike, observers should monitor for the following "watch signals":
- The "Post-Episode" Decay Rate: Observe how quickly the 4,799.7 posts/hour rate drops over the next six hours. A slow decay suggests deep discussion; a rapid drop suggests a purely reactionary burst.
- Secondary Hashtags: Look for character names or specific catchphrases associated with #MrFanboyEP3. If these gain independent traction, it indicates deeper narrative investment from the audience.
- Episode 4 Forecast: Set a benchmark for the same time window next week. If #MrFanboyEP4 meets or exceeds a 5,000 posts/hour rate, the property is officially in a growth phase.
- Creator Engagement: Monitor if the actors or production staff are interacting with the hashtag, as this often fuels a second wave of activity known as the "response spike."
Methodology and limitations
This report is based on a measured change rate of 4,799.7 posts/hour derived from two stored observations over a 900-second (15-minute) window. This specific timeframe is excellent for capturing "peak" intensity during a live event but may over-represent the topic's overall daily importance. The snapshot volume of 6,000 posts represents the total count at the end of that window.
The data is categorized under "Entertainment" based on algorithmic tagging of the hashtag's usage environment. Users should be aware that social media volume is susceptible to manipulation via automated accounts, though the velocity observed here is consistent with human-led live-viewing patterns. This briefing should be used as a starting point for deeper sentiment and demographic analysis.
Track This Topic for New Signals
Set alerts for future velocity or sentiment changes around this topic.
Explore Tracking PlansAbout TrendsAGI research
TrendsAGI's automated research pipeline publishes dated signal snapshots, methodology notes, and practical workflows for teams evaluating cultural momentum. Read how signals are scoped, scored, and limited in our research methodology.


