1357-second window · 3 observations · Measured Aug 26, 2026, 7:59 PM UTC · Provider: go_recent_snapshot_v2
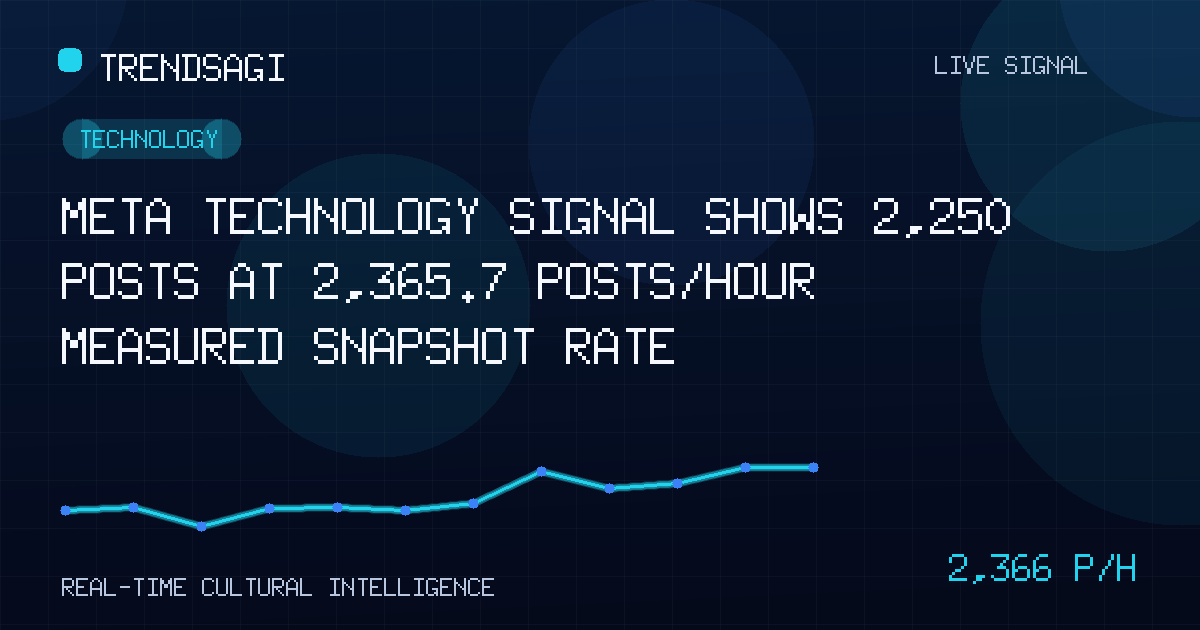
Meta Technology Signal Shows 2,250 Posts at 2,365.7 Posts/Hour Measured Snapshot Rate
On 2026-08-26, Meta tech posts hit 2,250 with a 2,365.7 posts/hour measured rate; cause unverified, monitoring guidance included.
Automated briefing. Generated from stored signal measurements and source-backed research; it is not manually reviewed. Read the methodology and limitations.
Metrics in this briefing are a snapshot associated with its publication date and may not reflect current conditions.
What changed
At 2026-08-26T19:59:11Z, the stored technology signal tagged with the topic label Meta recorded a snapshot volume of 2,250 posts. The direct answer for trend monitors is that conversation volume around this label was elevated and quantifiable at that precise moment, providing a clear anomaly point in the stored dataset.
Over an exact 1,357-second window anchored to that snapshot and built from three stored observations, the measured snapshot rate was 2,365.7 posts per hour. This measured change rate reflects stored post counts within the observation window; it is not a live, current, or projected rate, and it is not a measure of unique individuals, reach, or engagement actions. The figure should be read as a historical measurement, not a real-time pulse.
| Observation time (UTC) | Measured posts/hour | Snapshot volume (posts) |
|---|---|---|
| 2026-08-26T19:59:11Z | 2365.7 | 2250 |
Why this topic may be moving
We attempted to verify a public explanation for the movement using publisher-sourced information accessible under search constraints. No verified external report from a named publisher was available to confirm a specific catalyst such as a product launch, earnings release, regulatory action, technical outage, or executive statement tied to the observation time. In line with editorial standards, we omit unverified claims and state plainly that the cause of the elevated measured snapshot rate and snapshot volume remains unclear.
The topic label Meta sits in the stored Technology category, which suggests the posts relate to Meta Platforms, its family of apps, or adjacent technology ecosystem concerns. Without verified publisher context, we cannot attribute the surge to any particular event, nor can we confirm whether the posts are positive, negative, or neutral in tone. The absence of a verified cause is itself a finding: it tells readers that the spike preceded or escaped clear public attribution at the time of measurement.
Readers should treat the missing explanation as a signal to seek primary sources before drawing conclusions. A high measured rate alone does not explain itself, and treating it as evidence of a known event would be premature. The correct posture is to flag the anomaly and wait for corroboration.
Why it matters
Organizations that track technology discourse should care about this signal because it establishes a concrete, time-stamped baseline of conversation intensity. The combination of a 2,250-post snapshot and a 2,365.7 posts/hour measured rate provides a quantifiable anomaly relative to quieter periods, assuming historical comparisons are available in the stored dataset. For teams accustomed to monitoring Meta, this number is a reference point against which future surges can be compared.
Who should care:
- Social listening and brand intelligence teams monitoring Meta's reputation across platforms.
- Financial analysts assessing attention spikes that may precede market-relevant news or volatility.
- Researchers studying platform governance, artificial intelligence, or virtual reality ecosystems.
- Journalists verifying whether a narrative is forming before publishing or quoting unverified claims.
- Policy staff tracking sudden shifts in public technology conversation for regulatory foresight.
The signal can establish that a notable volume of posts occurred in a narrow window. It cannot establish the proportion of authoritative sources versus ordinary users, the geographic distribution, the languages represented, or the downstream real-world effects. Decision-makers should pair this briefing with sentiment and source-quality analysis before acting.
The 2,365.7 posts per hour figure is a measured snapshot rate derived from three stored observations over a fixed 1,357-second window; it is not a count of distinct users, nor a forecast of future volume.
Practical value comes from triangulation. A measured surge invites questions: Was there a coordinated campaign? Did a verified publisher break news that our search could not confirm? Is the stored volume capturing a subset of platforms? The briefing flags the need for those checks rather than answering them definitively. Original analytical value lies in separating the quantifiable surge from the unverified narrative.
Another reason this matters is risk of overreaction. Teams that receive only the snapshot volume might alarm stakeholders unnecessarily. By presenting the measured rate with its exact window and observation count, we give a disciplined frame that resists hype while still signaling that something unusual was recorded.
What to watch next
Concrete watch signals for the next 24 to 72 hours should focus on persistence and verification:
- Whether subsequent snapshots sustain a measured rate above 2,000 posts/hour or revert toward baseline.
- Whether the snapshot volume climbs beyond 2,250 posts in the same category, indicating accumulating discussion.
- Appearance of publisher-sourced reports from technology outlets that explain the spike after the fact.
- Official communications from Meta's corporate channels, investor relations, or regulatory filings.
- Movement in related stored signals such as Facebook, Instagram, Reality Labs, or Llama that could indicate topic spillover.
- Changes in posting frequency distribution, such as many small bursts versus one large burst.
Next checks for analysts include pulling the three underlying observations to inspect timestamps, validating the 1,357-second window math, and segmenting posts by language if the stored system supports it. If a verified external event emerges, map it to the observation window to test causality. Until then, treat the listed watch signals as the minimum monitoring program.
We also recommend monitoring for abrupt drops. A short-lived spike may reflect a transient hashtag or a single viral post replicated across accounts, whereas a plateau suggests sustained interest. The measured snapshot rate is a starting point, not a conclusion.
Methodology and limitations
The measured snapshot rate of 2,365.7 posts/hour was computed from three stored observations across an exact 1,357-second window, with the final observation taken at 2026-08-26T19:59:11Z. The latest snapshot volume at that moment was 2,250 posts. These values are reported exactly as stored; no number has been transformed or rounded beyond the supplied precision. The rate is described only as a measured snapshot rate, adhering to editorial rules that forbid calling it a live, current, forecast, reach, engagement, or unique-person count.
Limitations to keep in mind:
- The rate is a measured snapshot, not a live feed; it describes a past window, not the present moment.
- Snapshot volume counts posts in storage, not unique authors, impressions, or engagement depth.
- No stored signal description was provided, so the semantic scope of Meta posts is not defined by this briefing.
- We did not verify a causative event; the reason for movement is explicitly unclear.
- Search verification was constrained to publisher attribution, and none was found that met the standard.
- The observation set includes only three stored data points, which limits granularity of trend shape.
Used correctly, this briefing gives trend monitors a defensible numeric anchor. Used carelessly, it could be misinterpreted as evidence of a known event. The disciplined reading is that a significant, measured conversation surge around the Meta technology label occurred at the stated time, and its cause awaits verified public confirmation. Future briefings should append source links from trusted publishers to convert this anomaly into an explained trend. Until then, the data stands as a measured signal, not a concluded story.
Analysts should archive the observation time and measured rate exactly as presented. When new verified context appears, revisit the snapshot to determine whether the stored posts align with the reported event. That loop closes the gap between raw volume and explained change.
Track This Topic for New Signals
Set alerts for future velocity or sentiment changes around this topic.
Explore Tracking PlansAbout TrendsAGI research
TrendsAGI's automated research pipeline publishes dated signal snapshots, methodology notes, and practical workflows for teams evaluating cultural momentum. Read how signals are scoped, scored, and limited in our research methodology.


