896-second window · 2 observations · Measured Oct 6, 2026, 2:26 AM UTC · Provider: go_recent_snapshot_v2
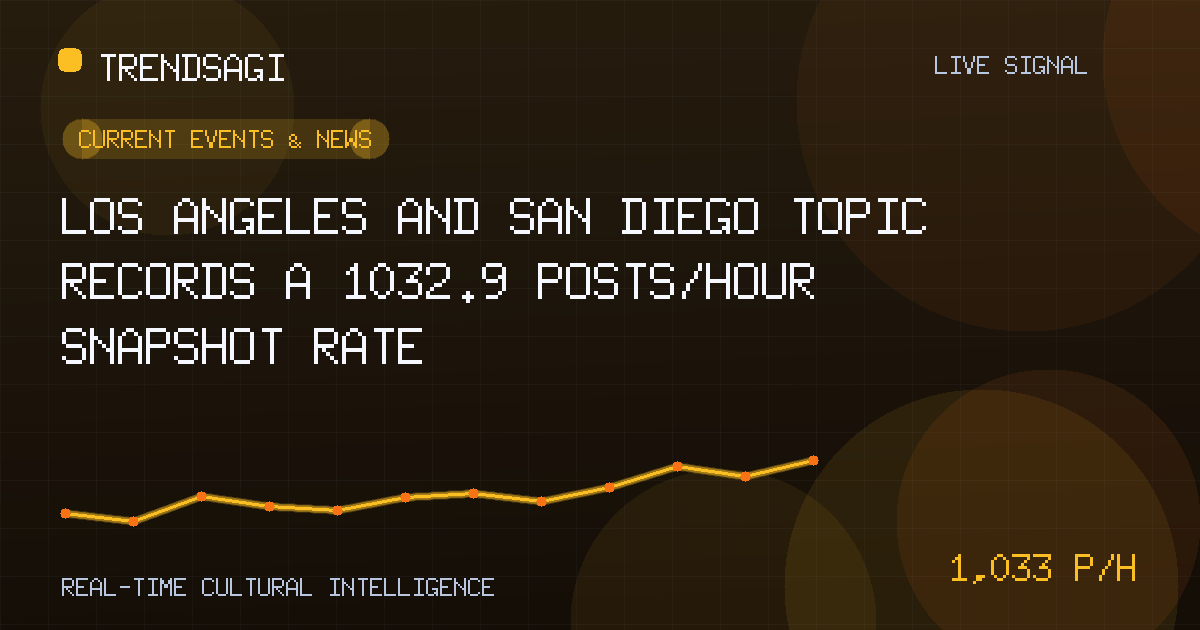
Los Angeles and San Diego topic records a 1032.9 posts/hour snapshot rate
Los Angeles and San Diego posts rose at a measured 1032.9 posts/hour over 896 seconds; the cause remains unverified, with practical next checks explained.
Automated briefing. Generated from stored signal measurements and source-backed research; it is not manually reviewed. Read the methodology and limitations.
Metrics in this briefing are a snapshot associated with its publication date and may not reflect current conditions.
What changed
The stored Los Angeles and San Diego topic registered a measured snapshot rate of 1032.9 posts/hour over an exact 896-second window, based on 2 stored observations ending at 2026-10-06T02:26:50Z. The latest snapshot contained 562 posts. The direct finding is an increase in captured posting volume during that measured window; it is not a live citywide activity count.
| Observation time | Measured snapshot rate | Snapshot volume |
|---|---|---|
| 2026-10-06T02:26:50Z | 1032.9 posts/hour across 896 seconds; 2 observations | 562 posts |
The label is geographic rather than event-specific. The dataset shows more captured posts assigned to Los Angeles and San Diego during the interval, but it does not show that both cities experienced the same issue, that one story caused the rise, or that the pattern remained active after the snapshot. The 562-post figure describes volume at the observed endpoint; 1032.9 posts/hour describes the measured change across the window.
Why this topic may be moving
For this observation, no verified public context establishes a cause. The available record names only a broad geography and classifies it under Current Events & News; it does not identify an event, institution, policy, or incident. A specific causal explanation would therefore be unsupported.
Several mechanisms could produce the pattern, but they remain hypotheses:
- A breaking local or regional development could create a concentrated wave of reporting and commentary.
- A broader story could repeatedly mention both metropolitan areas, making the geographic trend visible without a locally originated event.
- Scheduled civic, sports, cultural, or commercial activity could increase ordinary posting, although no particular event is identified here.
- Reposting, duplicated items, platform activity, or broad geographic classification could amplify the count without a proportional rise in original discussion.
Resolving the uncertainty requires the underlying post sample and time-matched public reporting. Until those are available, the cause should be described as unclear rather than attached to a guessed headline.
The strongest defensible conclusion is that captured posting volume increased under a broad geographic label; the available evidence does not yet identify a triggering event.
What the signal can establish
The signal is useful as a monitoring and triage tool. It establishes that the measured collection recorded a positive change between two observations and provides a latest snapshot size. That is enough to decide where closer inspection is warranted.
- It can identify a short-window change that merits review against a longer baseline.
- It can help editors locate the posts and sources behind the label.
- It can serve as an early warning that discussion under a geographic label is increasing.
- It cannot establish sentiment, factual accuracy, public importance, or the operational effects of the underlying posts.
It also cannot distinguish original discussion from duplicated or reposted content. Without that separation, the measured rise may overstate the amount of independently produced activity.
Why it matters
Local newsrooms can use the change to prioritize verification. The immediate task is not to publish a speculative explanation, but to determine whether a large share of the posts refers to a common, timely event and whether reliable public sources corroborate it.
Public agencies, transportation operators, businesses, and event teams should treat the signal as a prompt to monitor, not as evidence of an emergency, service disruption, or other real-world condition. A sharp increase in posts alone does not establish any of those outcomes.
Researchers and trend analysts gain a candidate point for baseline comparison. Its value depends on whether comparable increases appear in adjacent windows, whether the pattern survives duplicate removal, and whether it recurs under consistent collection and classification methods.
What to watch next
- Inspect the source posts. Review items attached to both observations, including their timestamps, text, originating accounts or publishers, platforms, location references, and any linked topics.
- Measure duplication. Separate original posts from reposts, copied headlines, automated shares, and repeated links. Compare the result with the recorded 1032.9 posts/hour snapshot rate.
- Resolve the geography. Determine whether the increase comes from Los Angeles, San Diego, both locations, or content that was grouped only because it mentioned the broader region.
- Identify topic coherence. Cluster the posts by subject rather than location alone. A rise tied to one verifiable development is more interpretable than a miscellaneous geographic increase.
- Check time-matched public context. Use a time-bounded Google Search review to determine whether a credible explanation existed during the exact window. Corroborate any candidate cause with an official source or established publisher before attributing the movement to it.
- Extend the baseline. Compare additional windows of the same duration and under the same collection conditions. Persistence across several observations would provide stronger evidence than this short interval alone.
Concrete watch signals
- Persistence: further positive change in adjacent snapshots rather than a single isolated interval.
- Coherence: posts concentrating around one clearly identifiable issue.
- Geographic concentration: a clear split between Los Angeles, San Diego, and region-wide references.
- Independent corroboration: timestamped official or reputable reporting that aligns with the captured posts.
- Normalization after deduplication: evidence that the increase remains substantial when repeated content is removed.
Methodology and limitations
The 1032.9 posts/hour figure is a measured snapshot rate derived from 2 stored observations over an exact 896-second window and stamped 2026-10-06T02:26:50Z. It is not a live or current rate, forecast, reach estimate, engagement measure, or count of unique people. The separate 562-post figure is the latest snapshot volume and should not be treated as interchangeable with the rate.
The window is short and the observation count is limited, so the result is sensitive to timing and normal posting volatility. No longer-term baseline is supplied. Platform coverage, collection frequency, geographic classification rules, and the proportion of original versus duplicated posts are also unknown. The timestamp marks the stored observation, not necessarily the onset of the underlying discussion. Because no candidate cause has been verified for the exact interval, this briefing establishes a measured increase but not its cause, broader significance, or duration.
Track This Topic for New Signals
Set alerts for future velocity or sentiment changes around this topic.
Explore Tracking PlansAbout TrendsAGI research
TrendsAGI's automated research pipeline publishes dated signal snapshots, methodology notes, and practical workflows for teams evaluating cultural momentum. Read how signals are scoped, scored, and limited in our research methodology.


