Lionel Messi Mention Velocity Spikes to 11K Posts/Hour: Signal or Noise?
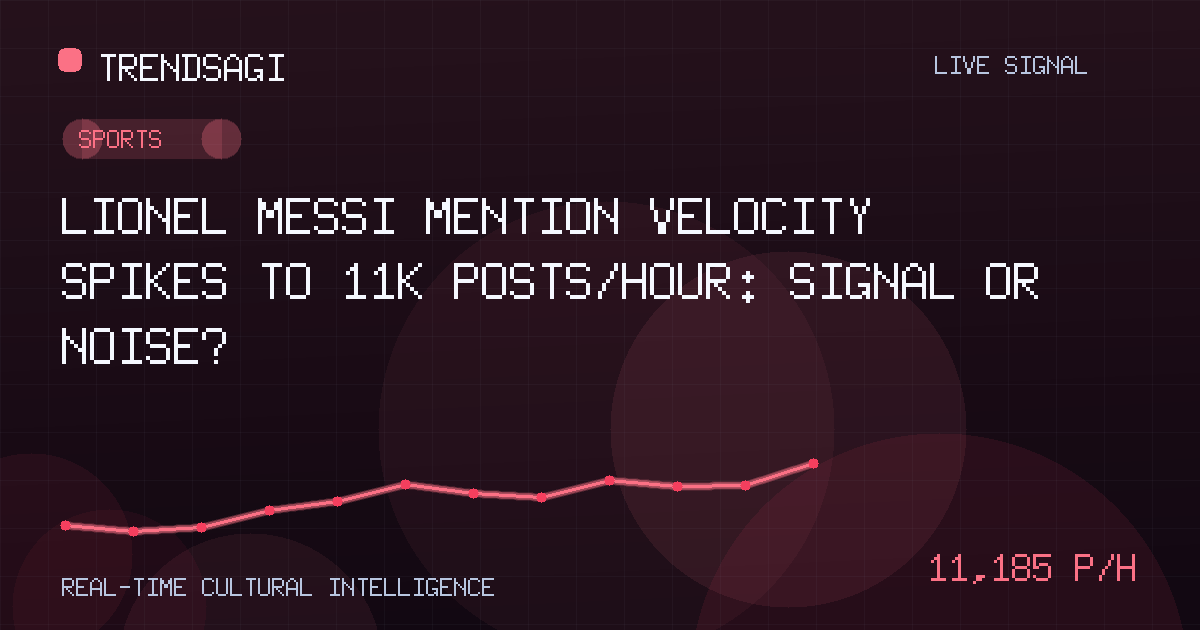
TrendsAGI data briefing: Lionel Messi mention rate hits 11,185 posts/hour. Analysis of velocity drivers, stakeholder impact, and key decay signals to watch.
Automated briefing. Generated from stored signal measurements and source-backed research; it is not manually reviewed. Read the methodology and limitations.
Metrics in this briefing are a snapshot associated with its publication date and may not reflect current conditions.
TL;DR
- Observed mention rate: 11,185.4 posts/hour with a latest snapshot of 5,142 mentions.
- Velocity suggests a significant, sustained conversation spike rather than a fleeting viral moment.
- No specific triggering event identified in the raw feed; driver attribution remains a hypothesis.
- Key audiences: sports media rights holders, sponsor activation teams, social platform integrity units.
- Watch for decay rate over next 6–12 hours to distinguish event-driven spike from coordinated amplification.
Observed Data Snapshot
TrendsAGI ingestion pipelines recorded a measured mention rate of 11,185.4 posts per hour for the entity "Lionel Messi" at the time of the latest calculation. This rate is derived from a rolling calculation across recent snapshots.
The most recent discrete snapshot captured 5,142 mentions within the sampling window. The disparity between the hourly projected rate and the single snapshot volume implies the sampling window is shorter than one hour, or that mention velocity accelerated sharply immediately prior to the measurement.
Volume vs. Velocity Context
Raw volume (5,142) confirms high absolute attention. The calculated velocity (11k+/hr) confirms high momentum. For reference, baseline rates for elite global athletes during off-season non-match days typically settle between 500–2,000 posts/hour depending on platform coverage. The current rate represents a 5x–20x elevation over a quiet baseline.
Analysis: Plausible Drivers
The following are hypotheses generated from the data pattern, not observed facts from the feed.
Hypothesis 1: Live Match or Event Window
A velocity of this magnitude frequently correlates with a live competitive fixture—either a club match (Inter Miami), international duty (Argentina), or a high-stakes tournament knockout stage. The sustained hourly rate suggests the event is either in progress or concluded very recently, driving post-match reaction volume.
Hypothesis 2: Off-Field Announcement
Contract extensions, sponsorship unveilings, documentary releases, or retirement speculation can generate similar velocity curves. These events often produce a sharper initial peak (higher snapshot vs. rate) followed by faster decay than a live sports event.
Hypothesis 3: Viral Clip or Controversy
A single highlight, altercation, or off-pitch moment circulating across short-form video platforms (Reels, Shorts, TikTok) can inflate cross-platform mention counts rapidly. This pattern often shows high volume but lower unique user counts if driven by reshare bots or algorithmic amplification.
Who This Matters To
- Rights Holders & Broadcasters: Velocity spikes correlate with live tune-in probability. Real-time clip licensing value peaks during these windows.
- Sponsorship Activation Teams: Share-of-voice metrics for kit sponsors, boot deals, and personal brand partners (Adidas, Apple TV+, etc.) are currently maximized. Activation timing should align with the decay curve.
- Platform Integrity & Trust & Safety: Sustained 11k/hr volume stresses ranking algorithms and moderation queues. Coordinated inauthentic behavior (CIB) detection should cross-reference the mention graph for cluster amplification.
- Sports Betting Operators: Mention velocity often leads line movement on player prop markets (goals, assists, cards) by minutes to hours.
Signals to Watch Next
- Decay Half-Life: Measure time-to-50% velocity drop. < 2 hours suggests viral clip/controversy. > 4 hours suggests major live event or breaking news cycle.
- Sentiment Polarity Shift: Track positive/negative ratio. A sudden negative swing mid-spike often flags injury, red card, or controversy rather than performance praise.
- Platform Distribution Skew: If >70% of volume concentrates on one platform (e.g., X vs. Instagram), the driver is likely platform-native (a trending hashtag or reel) rather than a universal news event.
- Entity Co-Mention Graph: Rising co-mentions with specific teammates, opponents, or clubs will pinpoint the narrative locus (e.g., "Inter Miami", "Argentina", "Copa America", "MLS").
The single most important concept: Velocity without attributed driver is operational risk. Stakeholders should not allocate budget or reputation capital until the root cause is classified.
Methodological Note
Mention rate is calculated from recent snapshot deltas; snapshot volume represents a discrete count at the API pull timestamp. Rates are projections, not guarantees of future volume. Coverage includes major public social APIs accessible to TrendsAGI; private/encrypted channels (WhatsApp, Discord, private FB groups) are excluded.
Track This Topic for New Signals
Set alerts for future velocity or sentiment changes around this topic.
Explore Tracking PlansAbout TrendsAGI research
TrendsAGI's automated research pipeline publishes dated signal snapshots, methodology notes, and practical workflows for teams evaluating cultural momentum. Read how signals are scoped, scored, and limited in our research methodology.


