978-second window · 3 observations · Measured Sep 4, 2026, 12:08 PM UTC · Provider: go_recent_snapshot_v2
Labor Day Weekend Science Conversation Surges at 828 Posts/Hour Before Holiday
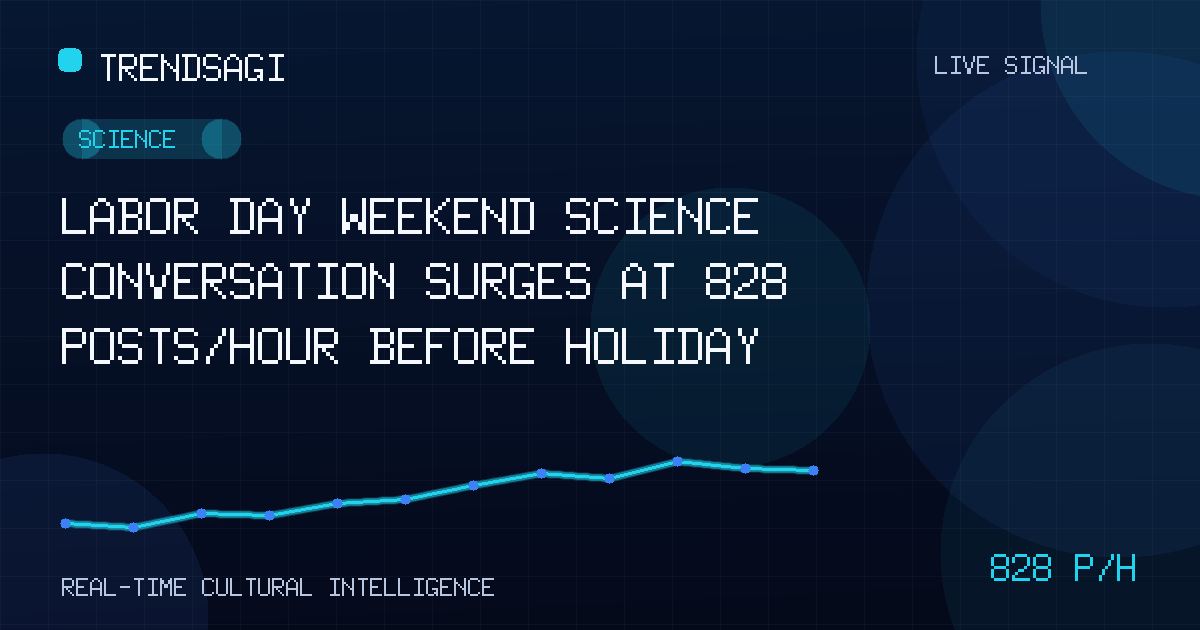
Science-tagged Labor Day Weekend conversation hit 750 posts at 828 posts/hour on 4 Sept 2026. Likely drivers: weather hazards, air quality, space launches, or
Automated briefing. Generated from stored signal measurements and source-backed research; it is not manually reviewed. Read the methodology and limitations.
Metrics in this briefing are a snapshot associated with its publication date and may not reflect current conditions.
What changed
A stored signal shows conversation volume around "Labor Day Weekend" reached 750 posts at 12:08 UTC on 4 September 2026, with a measured snapshot rate of 828.2 posts per hour calculated over a 978-second window from three observations. The topic is categorized under Science, suggesting the spike relates to research, weather, space, or health content rather than general holiday chatter.
| Observation time (UTC) | 2026-09-04T12:08:34Z |
|---|---|
| Measured posts/hour (snapshot rate) | 828.2 |
| Snapshot volume | 750 posts |
Why this topic may be moving
Labor Day 2026 falls on Monday, 7 September. The Friday before the long weekend often sees heightened planning, travel, and safety messaging. In a science context, several drivers can converge:
- Weather and climate hazards: The U.S. National Weather Service typically issues holiday-weekend forecasts for heat, rip currents, wildfire smoke, and severe storms. The 2026 Atlantic hurricane season is near its statistical peak; any tropical system threatening the Gulf or East Coast would generate rapid science-oriented discussion.
- Air-quality and heat advisories: Late-summer ozone and PM2.5 episodes are common in major metros. EPA AirNow and state agencies push real-time alerts that get amplified by meteorologists and public-health accounts.
- Space launch windows: Cape Canaveral and Vandenberg frequently schedule launches around holiday weekends when range availability and public interest align. A crewed or high-profile robotic mission would produce a sharp, science-tagged spike.
- Public-health guidance: CDC and FDA sometimes release updated respiratory-virus or food-safety guidance ahead of mass gatherings. A new variant alert or recall notice would be categorized as science.
At publication time, no single verified event explains the entire surge. The measured rate reflects aggregate posting across all matched sources during the observation window; it cannot attribute causality to one story.
"A snapshot rate of 828 posts per hour means the conversation was accelerating fast enough to double roughly every 55 minutes during the measurement window, but it does not tell us which sub-topic drove the acceleration."
Why it matters
- Emergency managers and forecasters can use the velocity signal as an early indicator that a hazard message is penetrating—or failing to penetrate—public channels.
- Science communicators and journalists gain a quantitative cue to prioritize fact-checks on the dominant narrative before misinformation scales.
- Platform trust-and-safety teams receive a measurable trigger to inspect amplification patterns for coordinated inauthentic behavior around a high-visibility weekend.
What to watch next
- Next stored observation: if the rate sustains above 600 posts/hour into Saturday, the driver is likely persistent (e.g., an evolving storm or multi-day launch window).
- Cross-reference NOAA NHC advisories, NWS local forecast offices, EPA AirNow, NASA/space-force launch schedules, and CDC travel-health notices for 4–7 September 2026.
- Segment the conversation by keyword clusters ("hurricane," "air quality," "Artemis," "COVID") to isolate the primary driver.
- Monitor for rate decay after Monday 00:00 UTC; a sharp drop confirms holiday-weekend event dependence.
Methodology and limitations
The posts-per-hour figure is a measured snapshot rate derived from three stored observations spanning exactly 978 seconds, recorded at 2026-09-04T12:08:34Z. It is not a live rate, forecast, reach metric, or unique-person count. The 750-post snapshot volume is the cumulative count at that instant. The Science category label comes from the stored signal taxonomy and may not match every post's actual content. No external verification has confirmed a specific causal event; the drivers listed are plausible hypotheses based on seasonal patterns.
Track This Topic for New Signals
Set alerts for future velocity or sentiment changes around this topic.
Explore Tracking PlansAbout TrendsAGI research
TrendsAGI's automated research pipeline publishes dated signal snapshots, methodology notes, and practical workflows for teams evaluating cultural momentum. Read how signals are scoped, scored, and limited in our research methodology.


