891-second window · 3 observations · Measured Oct 6, 2026, 7:56 AM UTC · Provider: go_recent_snapshot_v2
LA or SD travel signal measures 24238.3 posts/hour; catalyst remains unverified
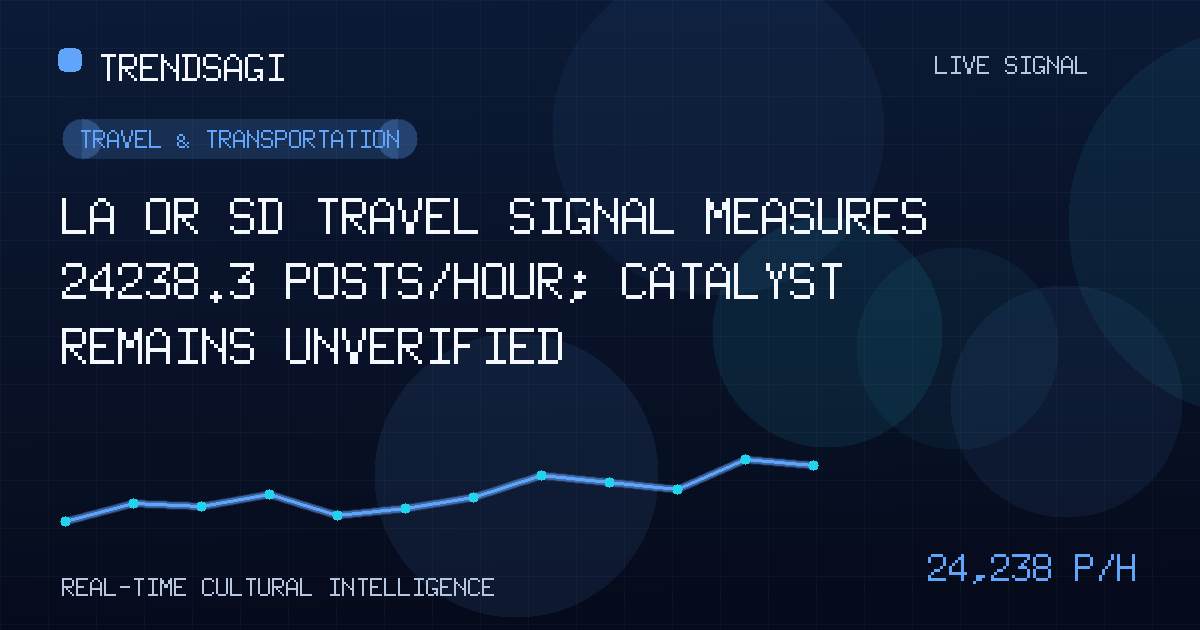
The LA or SD signal records 24238.3 measured posts/hour; here is what it shows, what it cannot prove, and which checks come next.
Automated briefing. Generated from stored signal measurements and source-backed research; it is not manually reviewed. Read the methodology and limitations.
Metrics in this briefing are a snapshot associated with its publication date and may not reflect current conditions.
What changed
Answer first: The “LA or SD” signal contains 24000 posts in its latest snapshot and records a measured snapshot rate of 24238.3 posts/hour. The activity is clear, but its cause and travel meaning are not. Observed at 2026-10-06T07:56:20Z, the signal shows concentrated discussion under an ambiguous label; it does not show that travelers definitively chose Los Angeles over San Diego, or the reverse.
That measured snapshot rate covers an exact 891-second window using 3 stored observations. It is not a live or current rate, forecast, reach figure, engagement total, or count of unique people. No verified public context explains the movement, so attributing it to an event, transit change, weather event, promotion, or controversy would go beyond the evidence. The catalyst remains unclear.
| Observation time | 2026-10-06T07:56:20Z |
|---|---|
| Snapshot volume | 24000 posts |
| Measured snapshot rate | 24238.3 posts/hour |
| Measurement window | Exact 891 seconds using 3 stored observations |
Why this topic may be moving
The topic is classified as Travel & Transportation, but no descriptive text explains the posts that produced it. In that setting, several ordinary mechanisms could create a short burst:
- Label compression: One trend label may combine Los Angeles with San Diego, or other abbreviated references. That can make a comparison look like a single phenomenon even when the underlying conversations concern different places.
- Decision-oriented chatter: People may be asking where to go, how to travel, what to do, where to stay, or how to compare prices and schedules. The category suggests that possibility but does not verify it.
- Reactivity: A service disruption, planned event, weather issue, or news story could drive repeated commentary. None can be tied to this signal without matching timestamps and verified public evidence.
- Repetition: A small number of highly repeated messages, quoted posts, or coordinated campaigns could lift post volume without representing a broad change in behavior.
These are testable explanations, not established causes. The missing topic description and absent verified context make “the audience is actively choosing between two destinations” the least defensible conclusion.
Why it matters
For destination marketers, transport planners, airports, rail and bus operators, hotels, event teams, and local editors, a short social burst can be an early warning that deserves triage. It may flag a question, complaint, logistics problem, or opportunity. It becomes operationally useful only after the conversation is separated by place, subject, intent, and time.
A large post count is evidence of attention within the measured collection, not proof of travel intent, sentiment, market share, or economic impact.
Ambiguity creates opposing risks. Operators may waste resources treating broad chatter as a city-specific demand surge. At the same time, a genuine service or safety issue could be missed if editors dismiss the signal because the label is unclear. The appropriate response is focused verification, not immediate reallocation or a destination campaign.
What the signal can establish
The signal supports limited factual claims: the latest snapshot reports 24000 posts; the measured change across the stated window is a measured snapshot rate of 24238.3 posts/hour; and the topic is classified under travel and transportation. Those facts establish scale within the collection at that moment.
The signal does not disclose the platform, collection boundaries, underlying observation counts, historical baseline, geography, language mix, duplication, authenticity, poster concentration, sentiment, or the share referring to each possible meaning of “LA” and “SD.” It also does not establish whether the posts express bookings, intentions, questions, complaints, or reposts. Snapshot volume and the measured snapshot rate answer different questions and should not be added together.
What to watch next
- Disambiguate the label. Review matching terms and place names rather than assuming that LA means Los Angeles and SD means San Diego. Separate city, county, airport, station, university, team, and other uses of the abbreviations.
- Build a destination split. Compare the share and rate of posts tied unambiguously to each place. Also report the portion that cannot be assigned; that remainder is material, not noise.
- Classify intent. Group posts into itinerary or booking questions, prices and availability, road or rail travel, air travel, lodging, events, disruptions, and general commentary. Preserve mixed and unclear posts.
- Corroborate with first-party evidence. Check official transport, airport, destination, event, emergency, and weather channels for information matching the observed timestamp and geography. A coincidental older story is not an explanation.
- Test persistence and breadth. Compare later snapshots with a longer baseline, then examine whether activity is distributed across distinct accounts and sources or concentrated in repeated content. Persistence matters more than the compressed measurement window.
- Add behavioral indicators. Look for changes in searches, route queries, bookings, cancellations, service requests, or official traffic reports. Keep those measures separate from post counts until a defensible relationship is demonstrated.
Methodology and limitations
The reported rate uses 3 stored observations across an exact 891-second window and is anchored to the latest observation at 2026-10-06T07:56:20Z. The underlying counts and calculation steps are not shown, so this briefing preserves the supplied measurement rather than reconstructing or extrapolating it.
The window is short for identifying a durable trend. Snapshot volume is not a rate, and the measured snapshot rate is not a forecast. Because no verified external explanation, baseline, location split, or platform context is available, this signal should be treated as a trigger for focused verification. It is not yet evidence that one destination gained travel demand from the other.
Track This Topic for New Signals
Set alerts for future velocity or sentiment changes around this topic.
Explore Tracking PlansAbout TrendsAGI research
TrendsAGI's automated research pipeline publishes dated signal snapshots, methodology notes, and practical workflows for teams evaluating cultural momentum. Read how signals are scoped, scored, and limited in our research methodology.


