888-second window · 3 observations · Measured Oct 8, 2026, 11:56 AM UTC · Provider: go_recent_snapshot_v2
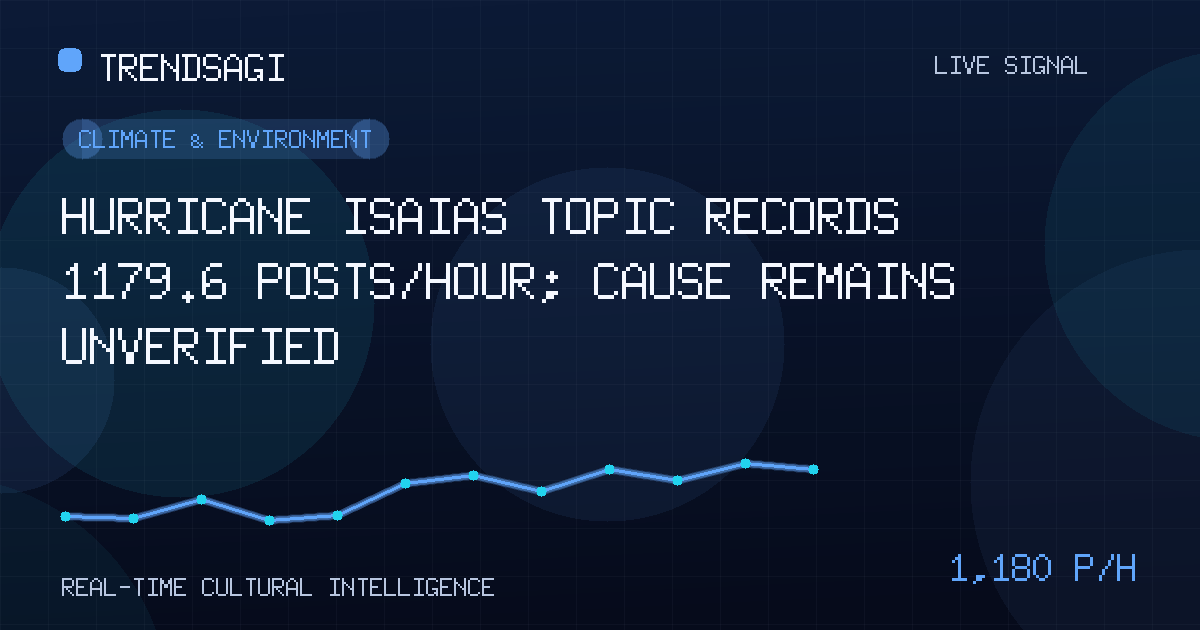
Hurricane Isaias topic records 1179.6 posts/hour; cause remains unverified
The Hurricane Isaias signal shows a measured snapshot rate of 1179.6 posts/hour; here is what can—and cannot—be concluded.
Automated briefing. Generated from stored signal measurements and source-backed research; it is not manually reviewed. Read the methodology and limitations.
Metrics in this briefing are a snapshot associated with its publication date and may not reflect current conditions.
What changed
The direct answer is that the topic labeled Hurricane Isaias is moving in the stored signal, while its cause remains unverified. The activity may reflect a public event, but the available record does not tie it to a confirmed storm development, forecast change, or impact.
At 2026-10-08T11:56:11Z, the measured snapshot rate was 1179.6 posts/hour over an exact 888-second window using 3 stored observations. The latest snapshot volume was 605 posts, which is the number captured in that snapshot—not a rate, reach estimate, engagement measure, or unique-person count.
| Metric | Stored value |
|---|---|
| Observation time | 2026-10-08T11:56:11Z |
| Measured snapshot rate | 1179.6 posts/hour |
| Latest snapshot volume | 605 posts |
The measurement captures a precise but limited window. Without a longer historical baseline, it cannot establish whether the rate is unusual for this topic, how long the movement lasted, or whether activity continued after the observation cutoff. It also does not show how many people or distinct locations generated the posts.
Why this topic may be moving
The material available for this briefing contains no verified external report tying the movement to a specific public event. The stored Climate & Environment category supplies broad context, but there is no event description identifying a location, official update, forecast revision, or impact. The trigger therefore remains unresolved.
Several explanations remain plausible and testable, but none should be reported as the established reason:
- A time-stamped weather update, forecast, warning, or impact report could have prompted sharing if such a development occurred; no particular update is verified here.
- Historical or retrospective material could be resurfacing and being mistaken for new information.
- Duplicate, automated, or low-context posts could increase volume without adding independent confirmation.
- Ambiguous wording, misspellings, or another use of the same name could merge unrelated conversations.
- Newsroom coverage or platform distribution could have amplified a smaller initiating event.
These are verification hypotheses, not causal findings. A label and a posting rate alone cannot resolve which explanation is correct.
The measured posting rate can direct editors and readers toward verification, but it cannot establish that an event occurred, that an official forecast changed, or that the claims in circulation are accurate.
Why it matters
The main risk is conflation: a rapidly moving topic label may look like an emergency signal even when its cause is unknown. For safety decisions, posting velocity is secondary to verified information from relevant local authorities.
- People under weather alerts should prioritize official local forecasts, warnings, and safety instructions rather than infer severity from social discussion volume.
- Journalists and editors should determine whether the posts concern current conditions, historical material, or an ambiguous reference before treating the label as breaking news.
- Emergency and communications teams should check for specific locations, timestamps, and corroborated hazards before amplifying discussion.
- Climate and environment researchers should separate event reporting from historical references, duplicate material, and unrelated uses of the name.
Organizations monitoring public attention can use the signal to prioritize verification, but not to infer storm behavior or declare an emergency. A large conversation can increase the need for checking; it does not replace the underlying evidence.
What to watch next
The next step is source-level verification rather than another volume-only comparison.
- Identify the subject precisely. Establish whether the posts refer to an active storm, a forecast, observed impacts, a historical event, or another use of the name.
- Check chronology. Review the earliest substantive posts in the moving sequence, compare their timestamps with the observation cutoff, and separate new information from reactions and recirculation.
- Separate source types. Distinguish official information, attributable journalism, first-hand observations, unattributed claims, and automated or duplicate posts.
- Verify concrete details. Match claimed locations, hazards, and times against attributable reporting or official information before repeating them.
- Check persistence. Add later observation windows to see whether the measured rate continues, declines, or breaks into distinct subtopics.
An event-backed explanation becomes more credible if several of these concrete signals appear together:
- An official bulletin or forecast revision with matching timing and geography.
- Multiple independent newsrooms confirming the same development.
- First-hand reports containing specific locations, timestamps, and observable conditions.
- Discussion shifting from repetition of the name to checkable operational details.
- Corrections or clarifications that directly address inaccurate circulating claims.
Conversely, a decline in a later snapshot without a matching official development would be consistent with transient attention. Continued volume dominated by duplicate material would also weaken the case for a new event. Persistent activity combined with corroborated facts would justify deeper reporting; volume without those checks should remain labeled an attention spike rather than a verified weather development.
Methodology and limitations
This briefing uses the observation at 2026-10-08T11:56:11Z, the supplied measured snapshot rate of 1179.6 posts/hour over the exact 888-second window, and the latest snapshot volume of 605 posts. The rate is based on 3 stored observations and describes change within that window only.
The series does not supply a historical baseline, platform-wide coverage, collection coverage, post provenance, duplication status, language distribution, geography, unique authors, engagement, or sentiment. Consequently, posts/hour cannot be interpreted as live traffic, forecast, reach, or a count of people. The topic label and category also do not establish official storm status.
No external event claim is presented as fact because no attributable public report was verified as an explanation for the movement. The defensible conclusion is narrow: the stored series records measurable posting activity under the Hurricane Isaias label, while the event identity and trigger still require verification.
Track This Topic for New Signals
Set alerts for future velocity or sentiment changes around this topic.
Explore Tracking PlansAbout TrendsAGI research
TrendsAGI's automated research pipeline publishes dated signal snapshots, methodology notes, and practical workflows for teams evaluating cultural momentum. Read how signals are scoped, scored, and limited in our research methodology.


