1798-second window · 2 observations · Measured Oct 8, 2026, 8:56 AM UTC · Provider: go_recent_snapshot_v2
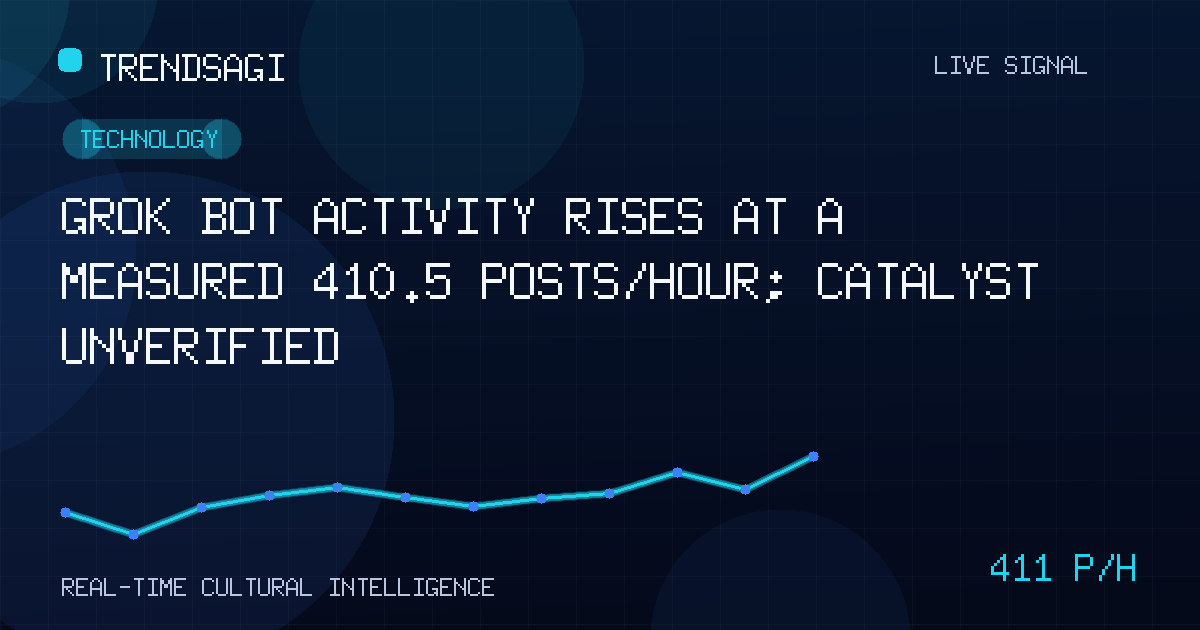
Grok Bot activity rises at a measured 410.5 posts/hour; catalyst unverified
The Grok Bot snapshot recorded 742 posts and a measured 410.5 posts/hour change; this briefing separates the signal from unverified explanations.
Automated briefing. Generated from stored signal measurements and source-backed research; it is not manually reviewed. Read the methodology and limitations.
Metrics in this briefing are a snapshot associated with its publication date and may not reflect current conditions.
What changed
The tracked “Grok Bot” topic showed increased posting activity, but its cause remains unverified. The latest stored observation recorded 742 posts, and the available record does not identify which announcement, incident, product change, or broader event—if any—drove the movement.
The measured snapshot rate was 410.5 posts/hour over an exact 1798-second window using 2 stored observations, with the snapshot observed at 2026-10-08T08:56:48Z. This is a historical interval measure, not a live or current rate, forecast, reach, engagement total, or count of unique people.
| Observation time | 2026-10-08T08:56:48Z |
|---|---|
| Measured snapshot rate | 410.5 posts/hour |
| Snapshot volume | 742 posts |
Why this topic may be moving
No verified public context was available to tie the increase to a specific publisher, organization, or event. The defensible conclusion is therefore narrow: the tracked series recorded more posting activity during the measured interval. Any more specific explanation would remain a hypothesis, not a verified finding.
- A product or policy announcement could trigger attention, but no such announcement is established here.
- A technical incident or service change could prompt repeated discussion, but no incident is verified.
- A third-party report, demonstration, or creator post could amplify a label; the record does not identify an originating source.
- Coordinated reposting or duplicate content could amplify apparent activity; author-level and repost data are absent.
The measured rate establishes that the tracked post total rose during one interval; it does not establish the cause, the contributors, or persistence.
The label also needs disambiguation. The stored category is Technology, but no description accompanies the topic. The name alone does not establish whether “Grok Bot” refers to an account, software agent, feature, project, nickname, or another object. Readers should not infer a product release, user adoption, or platform response from the label.
Why it matters
The signal is valuable as an attention detector, not as a conclusion. A measured interval rate can help teams decide what to inspect first, especially if sampled posts turn out to concern a live service. Yet the same rate could be produced by a narrow group repeating similar posts, so response decisions require source-level verification.
- Product and operations teams: If sampled posts concern a live feature or incident, the burst may warrant checks of support demand, availability, and user reports.
- Communications and newsroom teams: A fast rise can create pressure to respond, but an unverified catalyst should not be turned into a claim.
- Platform integrity and trust teams: Source concentration, duplicate wording, and account behavior can show whether “more posts” means broader participation or repetition.
- Researchers and analysts: The episode is a useful test case for separating volume, velocity, reach, and authenticity; the current record measures only the first two.
What the signal can and cannot establish
It is important to keep measurement separate from interpretation.
The available record establishes:
- The latest snapshot contained 742 posts at the stated observation time.
- The stored observations produced a measured snapshot rate of 410.5 posts/hour across the exact 1798-second window.
- The signal was assigned to the Technology category.
It does not establish:
- Why the topic moved; no verified catalyst is present in the record.
- Whether the pace persisted after the endpoint; only 2 observations are available.
- Whether sentiment was positive, negative, or neutral.
- How many unique people or accounts contributed.
- Whether activity was organic, coordinated, or automated.
- What reach, engagement, geography, or language mix the posts produced.
What to watch next
The next useful work is verification rather than extrapolation.
- Persistence: Take later snapshots and compare both endpoint volume and interval change. A sustained rise would support an ongoing trend; a reversal would make the current burst look more temporary.
- Catalyst timing: Find the earliest substantive posts and any independently verifiable public report. Check whether publication time precedes the repost wave rather than assuming the most visible item caused it.
- Topic identity: Review a representative sample and record what “Grok Bot” actually denotes. Reject posts that use the phrase in a different sense.
- Source concentration: Count distinct originating accounts and repeated wording where data allows. Broad participation and a small repost network imply different stories.
- Message diversity: Code sampled posts by claim, question, reaction, and link type. A high rate driven by one repeated claim needs different treatment from varied discussion.
- Historical context: Compare the topic with its own prior baseline and with adjacent technology topics observed over the same interval. Without that comparison, 410.5 posts/hour lacks a normal historical reference.
- Audience effects: Add unique authors, engagement, geography, and language only if those fields are available. Do not substitute them for post volume.
A practical interpretation test is straightforward: call this an event-driven trend only when a verified catalyst and continuing post-growth appear together. If activity recedes without one, label it a short-lived attention burst. If the meaning of the label remains mixed, report the topic as ambiguous rather than forcing a narrative.
Methodology and limitations
The rate comes from 2 stored observations separated by exactly 1798 seconds, ending at 2026-10-08T08:56:48Z. It is a normalized interval change in post count. Snapshot volume answers a different question: it is the 742 posts present at the observation time, not a rate, forecast, audience size, or engagement measure.
Two points can show that the recorded total rose at the supplied rate, but they cannot establish a stable baseline, seasonality, or persistence. No verified public context was available for attribution, so this briefing makes no claim about a release, incident, announcement, or advertiser. The Technology label is the only supplied classification. Readers should revisit the interpretation when later snapshots or verified reporting become available.
Track This Topic for New Signals
Set alerts for future velocity or sentiment changes around this topic.
Explore Tracking PlansAbout TrendsAGI research
TrendsAGI's automated research pipeline publishes dated signal snapshots, methodology notes, and practical workflows for teams evaluating cultural momentum. Read how signals are scoped, scored, and limited in our research methodology.


