1797-second window · 3 observations · Measured Sep 24, 2026, 11:56 AM UTC · Provider: go_recent_snapshot_v2
“Good Thursday” posts show a measured 1,836.8 posts/hour spike; cause remains unverified
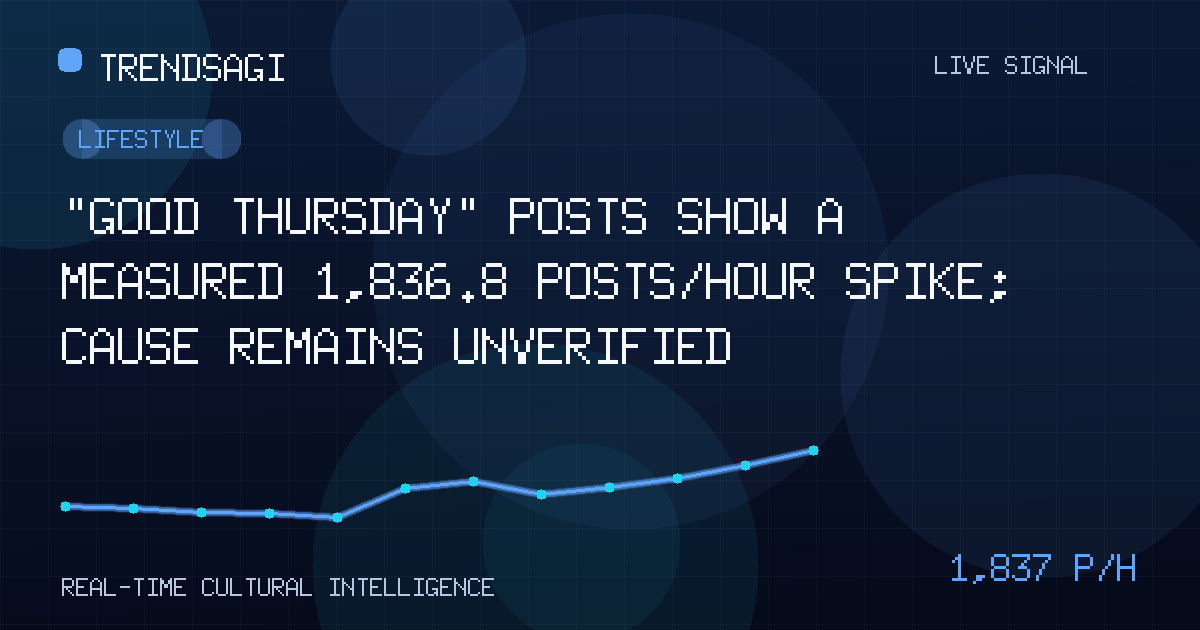
“Good Thursday” recorded 2,482 posts and a measured 1,836.8 posts/hour; the cause is unverified, so check persistence and content.
Automated briefing. Generated from stored signal measurements and source-backed research; it is not manually reviewed. Read the methodology and limitations.
Metrics in this briefing are a snapshot associated with its publication date and may not reflect current conditions.
What changed
The stored record for the “Good Thursday” label shows a sharp, short-window increase in posting activity, with 2,482 posts in the latest snapshot. The cause is not verified: neither the label nor its Lifestyle category identifies a particular event, campaign, or conversation driving that increase.
| Observation time | Measured snapshot rate | Snapshot volume |
|---|---|---|
| 2026-09-24T11:56:33Z | 1,836.8 posts/hour | 2,482 posts |
Across 3 stored observations in an exact 1,797-second window, the measured snapshot rate is 1,836.8 posts/hour at 2026-09-24T11:56:33Z. This is a historical measurement from the stored record, not a live or current rate, a forecast, reach, engagement, or a count of unique people.
The practical takeaway is to treat this as an increase in recorded post volume worth investigating, but not as proof of a broader cultural event or sustained demand. The activity warrants a timely content check; it does not establish why the posts appeared.
Why this topic may be moving
“Good Thursday” may be moving because existing discussion accelerated, a shared item circulated, or the label captured posts using an already familiar phrase. Those are possibilities, not findings. The supplied material does not provide post text, links, account information, or a verified public announcement connecting the increase to any one of them.
In particular, the phrase alone does not reveal whether the posts are greetings, reactions, event references, promotional material, or unrelated uses grouped under the same label. Treating an ambiguous label as a self-explanatory trend would risk reporting the measurement accurately but explaining it incorrectly.
- Possible acceleration: an ongoing conversation may have produced more posts during the measured window.
- Possible circulation: a shared post, image, meme, or other item may have prompted repeated use of the label.
- Possible reuse: an established phrase may have resurfaced without a new underlying event.
- Possible collection effects: changes in monitoring coverage or label matching may have affected the recorded volume.
None of these explanations is established by the current record. No specific public trigger has been verified for this briefing, so naming a holiday, news story, platform feature, or individual as the cause would go beyond the available evidence.
The signal establishes a rise in recorded posts associated with a label; it does not establish what those posts mean, why they appeared, or whether the pattern will persist.
Why it matters
For social-listening and community teams, the immediate value is triage. A measured increase can prompt a review of the underlying conversation: what is being shared, where the discussion appears to be spreading, and whether a response is needed. Those questions require examining posts, not merely repeating the aggregate count.
For editors and researchers, the distinction is especially important. This observation can support a dated account of increased activity, but it cannot establish sentiment, topic substance, audience size, or the influence of the accounts posting. The Lifestyle classification is metadata, not evidence that every post concerns lifestyle content.
For organizations monitoring mentions, the spike is an alert to verify—not an automatic instruction to respond. Repetition of a phrase is not equivalent to evidence of a shared belief, customer demand, or brand association. A campaign or public statement built on this signal alone could misinterpret the conversation it is meant to address.
What to watch next
The most useful follow-up checks are concrete:
- Check persistence. Compare later stored snapshots under the same collection conditions. A continued increase would support a more durable activity pattern; a quick retreat would favor describing the observation as a brief burst. These are tests, not predictions.
- Inspect the posts behind the label. Review a time-ordered, representative selection of the actual text and media. Look for shared wording, repeated images, direct references, repeated sources, and signs that a particular item is being copied or reinterpreted.
- Establish chronology. Determine whether a dated announcement, release, appearance, or other identifiable event occurred before the measured window. Any proposed explanation should fit the timing and be supported by verifiable evidence.
- Test whether activity extends beyond one stream. If available, compare relevant posts across platforms and regions while keeping collection rules consistent. This can help distinguish a distributed conversation from activity confined to the monitored source.
- Audit meaning and sentiment. Separate direct observations about well-being, promotion, humor, or other themes from assumptions based on the words “Good Thursday.” The stored record supplies neither a sentiment reading nor a verified description of the posts.
The strongest follow-up signal would be corroborated public context that both identifies a trigger and aligns with the observed timing. Until then, retain the measured increase, qualify its scope, and keep the cause explicitly unverified.
Methodology and limitations
This briefing uses the supplied observation time, the latest snapshot volume of 2,482 posts, and the measured snapshot rate of 1,836.8 posts/hour from 3 stored observations over exactly 1,797 seconds. The topic label is “Good Thursday,” the stored category is Lifestyle, and the stored signal description is empty. These are record fields, not independent verification of what the posts mean or why they appeared.
The record does not include the earlier observation values, a longer comparison period, a baseline, platform coverage, geography, language, post text, or deduplication information. The 3 observations support reporting the supplied measurement, but not characterizing persistence, seasonality, organic participation, automation, or the total conversation. The snapshot volume and measured snapshot rate are different measures and should not be added together or read as people reached.
No external fact is offered as a cause because a specific public trigger could not be verified for this briefing. Readers should distinguish a well-measured spike from an explained one: this signal supports the former, while the latter still needs evidence.
Track This Topic for New Signals
Set alerts for future velocity or sentiment changes around this topic.
Explore Tracking PlansAbout TrendsAGI research
TrendsAGI's automated research pipeline publishes dated signal snapshots, methodology notes, and practical workflows for teams evaluating cultural momentum. Read how signals are scoped, scored, and limited in our research methodology.


