1812-second window · 3 observations · Measured Sep 26, 2026, 11:56 PM UTC · Provider: go_recent_snapshot_v2
Georgia signal shows 1340.7 measured snapshot posts/hour; cause remains unclear
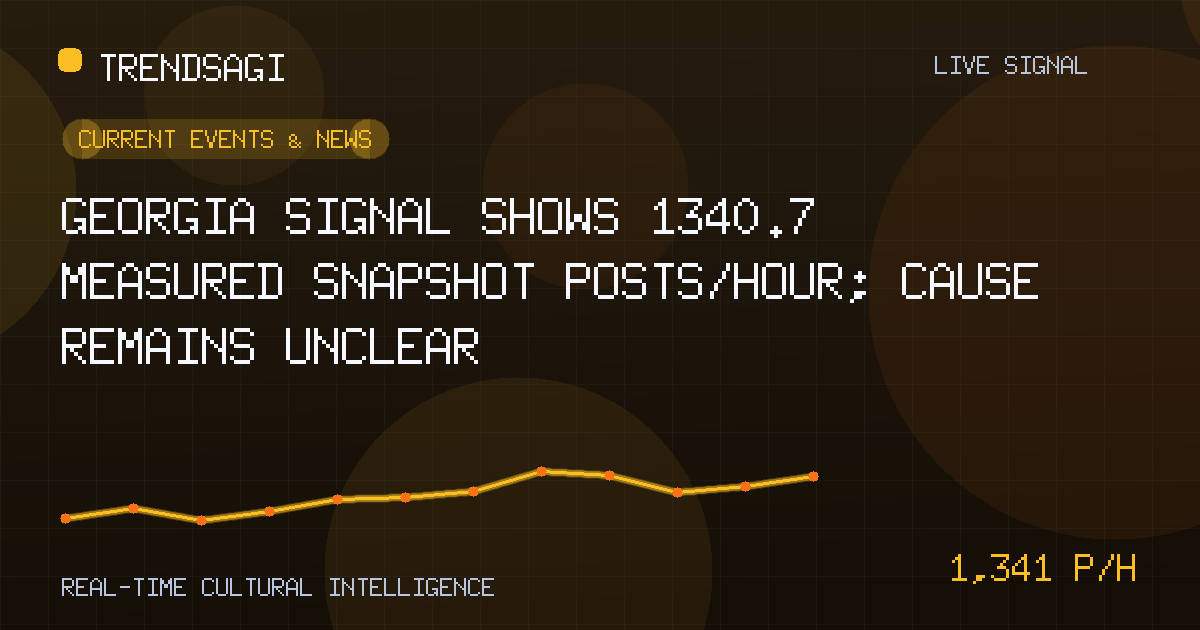
A 1440-post snapshot and measured snapshot rate of 1340.7 posts/hour show “Georgia” activity, while its trigger and geography remain unclear.
Automated briefing. Generated from stored signal measurements and source-backed research; it is not manually reviewed. Read the methodology and limitations.
Metrics in this briefing are a snapshot associated with its publication date and may not reflect current conditions.
What changed
The stored signal records a measured rise in posts associated with the label “Georgia,” but it does not identify the triggering event or establish whether the label refers to a country, a state, or another use of the name. The latest snapshot, observed at 2026-09-26T23:56:46Z, contains 1440 posts. The defensible answer is narrow: “Georgia” is moving in this monitored signal, while the reason for that movement remains unverified.
Across an exact 1812-second window, the measured snapshot rate was 1340.7 posts/hour using 3 stored observations. That figure describes the sampled pace during this interval; it is not a live or current rate, forecast, reach, engagement figure, or count of unique people. The 1440 figure has a different role: it is the latest snapshot volume, not a rate.
| Metric | Recorded value |
|---|---|
| Observation time | 2026-09-26T23:56:46Z |
| Latest snapshot volume | 1440 posts |
| Measured snapshot rate | 1340.7 posts/hour |
| Measurement window | 1812 seconds |
| Stored observations | 3 |
Why this topic may be moving
No independently verified public context accompanies the stored observation. Several explanations remain possible, and none can be selected responsibly from the broad label alone.
- Label collision: Posts using “Georgia” in different geographic or non-geographic senses may be grouped together, making unrelated conversations appear connected.
- A genuine news catalyst: A scheduled announcement, breaking development, political story, sports result, cultural event, or public controversy could have produced a real cluster, but no specific event has been verified here.
- Repetition rather than broad interest: Synced accounts, repeated article links, automated posting, or repost networks can increase volume without representing the same number of distinct participants.
- A monitoring effect: A change in collection coverage, query matching, category assignment, or the mix of represented sources could contribute to the measured movement. The available record cannot rule this out.
What the signal can and cannot establish
The signal establishes a specific observation time, a latest volume of 1440 posts, and a measured snapshot rate of 1340.7 posts/hour over the stated window. It also identifies “Georgia” as a topic requiring verification before further reporting or decision-making.
It does not establish:
- which event, if any, caused the increase;
- the country, locality, language, or audience behind the posts;
- whether the posts express agreement, opposition, curiosity, or unrelated reactions;
- how many distinct people or accounts participated;
- whether the activity is organic, automated, duplicated, or coordinated;
- whether the rate is unusual compared with a historical baseline; or
- the likely duration of the movement.
Trend volume is a prompt to verify, not an explanation. Before describing activity as a Georgia news event, readers need a resolved location, a dated catalyst, and evidence that the posts are distinct rather than repetitions.
Why it matters
For newsrooms and editors, the immediate risk is misclassification. Assigning the activity to the wrong Georgia could direct reporters toward an irrelevant story or cause a real event elsewhere to be missed. A responsible coverage decision requires examining the underlying posts and resolving the label before using a headline, map, or geographic label.
For organizations monitoring political, civic, commercial, or reputational developments, the volume is a useful alert but not an actionable finding by itself. Communications and risk teams should avoid treating the measured rate as evidence of public sentiment or crisis severity until they know who is posting, where they are located, and what they are responding to.
For researchers and community managers, the signal is best treated as a lead for sampling. The next analytical step is not to amplify the trend, but to determine whether it reflects broad independent participation, repeated content, a narrow local story, or a classifier capturing the wrong meaning.
What to watch next
- Inspect the matching posts. Review a representative sample for the exact text that caused “Georgia” to match. Look for recurring phrases, linked articles, quoted names, place references, and changes in wording.
- Resolve the geography. Separate country-related, state-related, local, and non-geographic uses. Account tags and profile locations may help, but they should not be assumed to represent every post.
- Find a time-aligned public catalyst. Look for independently verified reporting or an official statement with a publication time that aligns with the start of the measured movement. A relevant event must fit both the topic and the timing.
- Check repetition and source quality. Determine how much content is duplicated across accounts and whether multiple independent publishers are driving distinct conversation. Repetition should be separated from genuine participation.
- Compare subsequent observations. Use the same category, matching method, observation length, and measurement definition. A continuing increase would support persistence; a rapid decline would favor a short spike, a one-off event, or a monitoring artifact.
- Measure breadth carefully. If data becomes available, examine distinct accounts, domains, languages, regions, and platforms. None of those dimensions can be inferred from the current snapshot count or posts/hour figure.
Concrete signs that would strengthen a real-event interpretation include a verified catalyst aligned with the observation window, a clear concentration of relevant geography, and independently authored posts that are not duplicates. Signs that would weaken it include mixed meanings under one label, synchronized repetition, no time-aligned catalyst, or a sharp reversal in the next comparable observation.
Methodology and limitations
This briefing uses the stored observation at 2026-09-26T23:56:46Z. The measured snapshot rate is 1340.7 posts/hour, calculated from 3 stored observations across an exact 1812-second window. The latest snapshot volume is separately reported as 1440 posts.
The rate is a historical, snapshot-specific measure. It should not be presented as live activity or carried forward without a new observation. No historical baseline is supplied, so the data cannot show whether this rate is exceptional for the topic. No post-level content, source distribution, account uniqueness, engagement data, geographic breakdown, or verified public catalyst is available. Because the cause remains unclear, the signal supports monitoring and verification, not a claim about what happened or why attention increased.
Track This Topic for New Signals
Set alerts for future velocity or sentiment changes around this topic.
Explore Tracking PlansAbout TrendsAGI research
TrendsAGI's automated research pipeline publishes dated signal snapshots, methodology notes, and practical workflows for teams evaluating cultural momentum. Read how signals are scoped, scored, and limited in our research methodology.


