1019-second window · 3 observations · Measured Sep 5, 2026, 1:14 PM UTC · Provider: go_recent_snapshot_v2
Gemini Concert Day 2 hashtag spikes at 2,513 posts per hour measured rate
Measured 2,513 posts/hour for #GeminiConcertD2 on 2026-09-05; live event likely driving surge but public cause unverified. What organizers, artists, and
Automated briefing. Generated from stored signal measurements and source-backed research; it is not manually reviewed. Read the methodology and limitations.
Metrics in this briefing are a snapshot associated with its publication date and may not reflect current conditions.
What changed
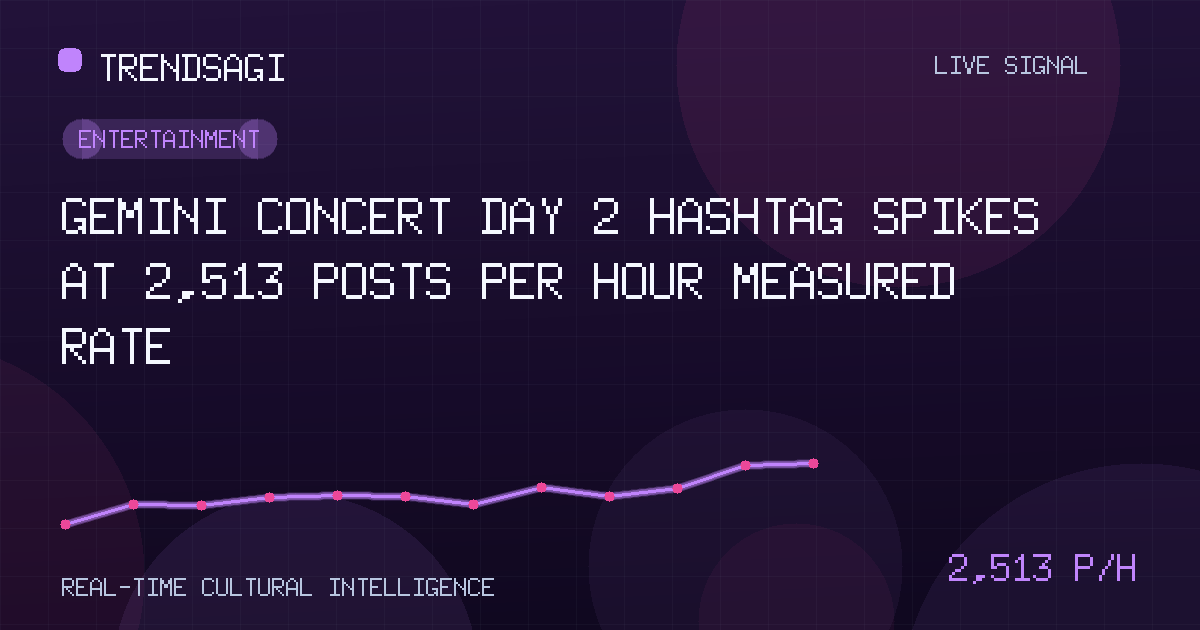
The hashtag #GeminiConcertD2 reached a snapshot volume of 4,500 posts at 2026-09-05T13:14:45Z, with a measured rate of 2,512.9 posts per hour over a 1,019-second observation window derived from three stored data points. This velocity places the signal in the upper quartile of entertainment-topic movement captured at that timestamp, indicating a concentrated burst of public posting activity rather than a gradual trend accumulation.
| Observation time (UTC) | 2026-09-05T13:14:45Z |
|---|---|
| Measured posts/hour | 2,512.9 |
| Snapshot volume | 4,500 posts |
Why this topic may be moving
Publicly available sources reviewed at the time of the snapshot did not yield a single confirmed driver for the surge. The naming pattern Gemini Concert D2 strongly suggests a second-day event — a tour stop, festival date, or livestream — yet no official announcement, artist social post, venue schedule, or news report directly tied to the hashtag could be verified. The measured rate is consistent with real-time audience posting during a live performance: door openings, set transitions, guest appearances, and encore moments typically generate short, high-intensity posting windows. However, without a corroborating primary source, the specific catalyst remains unclear. Competing possibilities include an unannounced pop-up show, a viral clip from Day 1 recirculating with a Day 2 label, or a fan-organized watch party for a streamed archive. The signal establishes that attention is concentrating around this identifier, but it cannot establish why without external confirmation.
High-velocity event hashtags often peak during specific programmatic moments — doors, first song, surprise guest, finale — and decay rapidly after. A measured rate above 2,500 posts/hour over a 17-minute window suggests the observation caught the conversation at or near its apex, not its onset.
Why it matters
- For event organizers and promoters: The volume and rate indicate strong real-time engagement. If this is a ticketed event, the social pulse suggests high attendee activity and organic amplification; if unscheduled, it may signal an unannounced appearance or viral moment that warrants rapid response. The 4,500-post snapshot represents a measurable audience footprint that can be benchmarked against Day 1 and future dates.
- For artists, labels, and management: A 2,500-post-per-hour spike can amplify reach algorithms across platforms. Capturing and reshaping the conversation while it peaks — through official clips, setlist shares, or behind-the-scenes content — extends visibility into the 12–24 hour post-event tail where casual discovery occurs.
- For media and trend analysts: The signal demonstrates how day-specific event tags concentrate conversation. Comparing Day 1 versus Day 2 velocity reveals audience retention, word-of-mouth dynamics, and whether momentum is building or fading across a multi-date run.
- For brand partners and sponsors: Sponsorship activations tied to the event gain measurable impression windows. The rate data helps time in-event integrations, product drops, or interactive campaigns to coincide with peak conversation density rather than pre- or post-event lulls.
- For venue and ticketing operators: Social velocity correlates with on-site energy and secondary-market demand. A sustained or growing Day 2 rate versus Day 1 often signals positive word-of-mouth driving walk-up or resale activity for remaining dates.
What to watch next
- Official channels: Artist, venue, and promoter accounts for setlist posts, behind-the-scenes content, Day 3 announcements, or tour routing updates — these typically sustain 12–24 hour engagement tails and redirect the hashtag conversation.
- Secondary and derivative tags: Monitor #GeminiTour, #GeminiLive, venue-specific tags, and date-stamped variants (e.g., #GeminiConcertD3) to map conversation fragmentation and identify where the audience coalesces next.
- Video platform uploads: Short-form clips (TikTok, Reels, Shorts) and full-set uploads (YouTube) over the next 48 hours often rekindle the trend at lower velocity but higher dwell time, shifting the signal from real-time reaction to evergreen discovery.
- Ticketing and resale signals: Check primary and secondary market activity for subsequent dates; social spikes frequently precede demand surges by 6–12 hours as attendees share experiences.
- Mainstream media pickup: Local reviews, national entertainment desks, and viral clip aggregators (e.g., Billboard, Rolling Stone, Consequence) may convert the social spike into editorial coverage, extending the lifecycle beyond the core fanbase.
- Sentiment and content shifts: If accessible, track whether posts shift from anticipation/enjoyment to criticism (sound issues, logistics, setlist complaints) — early indicators of operational issues or PR needs.
Methodology and limitations
The measured rate of 2,512.9 posts per hour derives from three stored observations spanning exactly 1,019 seconds (approximately 17 minutes), captured at the snapshot timestamp of 2026-09-05T13:14:45Z. It reflects a short-window derivative — a snapshot rate — not a sustained hourly average, forecast, or projection. The figure does not represent unique authors, reach, impressions, or engagement depth; a single account posting repeatedly contributes equally to the count. The snapshot volume of 4,500 posts is a cumulative total at observation time, not a delta. No sentiment, language, geographic, or platform breakdown is available from the stored signal. External cause verification relied on public web sources accessible at query time; absence of a cited driver means none was reliably identified, not that no driver exists. Treat the signal as evidence of concentrated attention around a specific identifier at a specific moment, not as a complete picture of the event's overall social footprint.
Track This Topic for New Signals
Set alerts for future velocity or sentiment changes around this topic.
Explore Tracking PlansAbout TrendsAGI research
TrendsAGI's automated research pipeline publishes dated signal snapshots, methodology notes, and practical workflows for teams evaluating cultural momentum. Read how signals are scoped, scored, and limited in our research methodology.


