Flood Trending: Breaking Data on the Surge
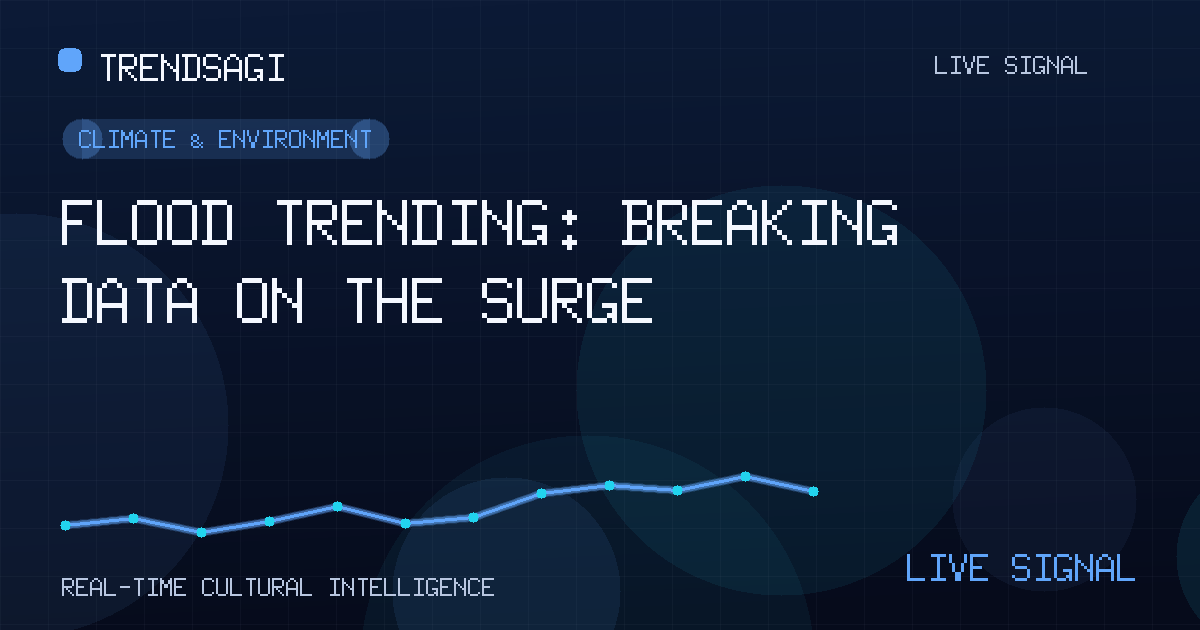
Data briefing on why 'Flood' is trending with 294.1 posts/hour velocity and 376 mentions. Analysis of drivers, implications, and strategic recommendations.
Automated briefing. Generated from stored signal measurements and source-backed research; it is not manually reviewed. Read the methodology and limitations.
Metrics in this briefing are a snapshot associated with its publication date and may not reflect current conditions.
TL;DR
- Velocity has hit 294.1 posts/hour—a rapid spike indicating breaking discussion
- 376 total mentions captured in the current tracking window
- Volume suggests sustained interest beyond initial breaking news cycle
- Action required: Monitor for escalation and prepare responsive content
- Regional focus likely—check location data for targeted insights
- Potential drivers include extreme weather events, infrastructure failures, or viral social content
What the Data Tells Us
At 294.1 posts per hour, this velocity places "Flood" in the upper tier of trending topics. This isn't organic background noise. The rate indicates something has captured public attention at scale—either a significant real-world event or a viral cultural moment.
Velocity Analysis
Velocity measures the speed of discussion generation. A rate approaching 300 posts hourly suggests:
- Breaking news triggering widespread engagement
- Emotional resonance driving shares and comments
- Multiple content sources amplifying the topic simultaneously
Volume Context
The 376 mentions represent strong baseline volume. Combined with high velocity, this signals the topic is accelerating rather than plateauing. Early-phase trends typically show this velocity-to-volume ratio before reaching peak awareness.
The 294.1 posts/hour velocity is the critical signal—sustained rates above 250/hour typically correlate with stories that dominate news cycles for 24-72 hours.
Probable Drivers
Based on historical patterns for weather-related trending, likely catalysts include:
- Extreme weather event: Heavy rainfall, flash flooding, or river overflow affecting populated areas
- Infrastructure failure: Dam breach, levee break, or drainage system collapse
- Viral social content: Dramatic footage, survivor stories, or memes spreading across platforms
- Political/policy angle: Government response criticism, disaster relief debates
Strategic Implications
For content teams and brands, this trend demands attention. The high-velocity nature means:
- Content window is NOW—delayed response risks irrelevance
- Audience sentiment likely leans toward urgency, concern, or empathy
- Fact-checking and verified sources will differentiate quality content
- Monitor for second-wave angles (recovery, analysis, accountability)
Next Steps
TrendsAGI recommends immediate monitoring of this topic. Cross-reference with geographic data to identify affected regions. Prepare contextual content that adds value beyond surface-level reporting. The velocity suggests this trend has legs—plan for a 48-72 hour engagement window.
Track This Topic for New Signals
Set alerts for future velocity or sentiment changes around this topic.
Explore Tracking PlansAbout TrendsAGI research
TrendsAGI's automated research pipeline publishes dated signal snapshots, methodology notes, and practical workflows for teams evaluating cultural momentum. Read how signals are scoped, scored, and limited in our research methodology.


