915-second window · 2 observations · Measured Sep 24, 2026, 1:56 PM UTC · Provider: go_recent_snapshot_v2
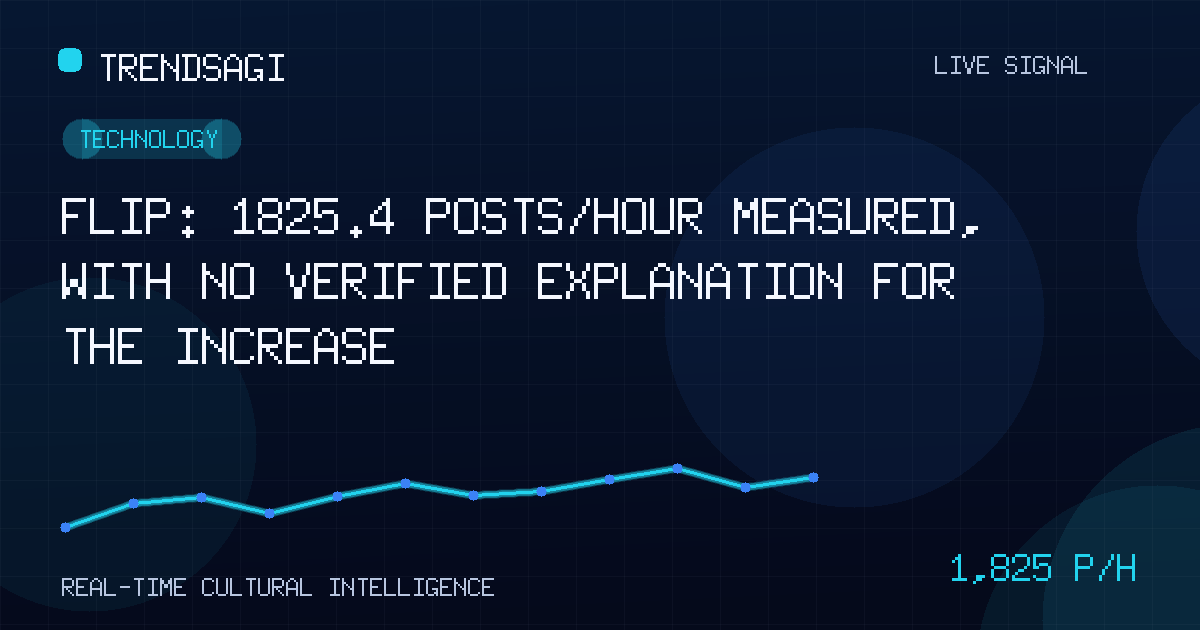
Flip: 1825.4 posts/hour measured, with no verified explanation for the increase
Flip's measured rate is 1825.4 posts/hour, with 1411 posts in the latest snapshot. The cause and persistence are unclear; these are the checks that matter next.
Automated briefing. Generated from stored signal measurements and source-backed research; it is not manually reviewed. Read the methodology and limitations.
Metrics in this briefing are a snapshot associated with its publication date and may not reflect current conditions.
What changed
Flip recorded an increase in posting activity measured at 1825.4 posts/hour, using an exact 915-second window. Its latest snapshot contained 1411 posts. The evidence establishes increased recorded activity between two observations, but not what caused it, whether it continued, or how many people took part.
The cause remains unconfirmed. The record stores “Flip” under Technology but supplies no supporting event description, and no verified public context is available here to connect the increase to a particular launch, controversy, product update, or platform event. Treat this as a signal worth investigating, not a confirmed technology story.
| Snapshot time | 2026-09-24 13:56:31 UTC |
|---|---|
| Latest snapshot volume | 1411 posts |
| Measured snapshot rate | 1825.4 posts/hour |
| Exact measurement window | 915 seconds |
| Stored observations | 2 |
How to read the measurement
The 1411 posts are the volume captured at the latest observation. The 1825.4 posts/hour figure describes the change in recorded volume over the 915-second interval, using two stored observations. It is neither a live rate nor a count of unique authors. The figures answer different questions and should not be added together or treated as interchangeable measures of interest.
A measured snapshot rate can justify another look without justifying a conclusion. It shows that the record changed; it does not identify the event, audience, or importance behind that change.
The window is short, and the record provides no longer-term baseline for comparison. A rate measured over this interval may reflect a temporary burst or the timing of collection; the available evidence cannot distinguish those possibilities. Nor does the figure establish how the activity compares with normal volume for this topic.
Why this topic may be moving
There is no verified driver to report. “Flip” is also an ambiguous label: it could refer to a named product or service, a feature, an action, or a reversal, among other subjects. The Technology classification does not resolve those meanings. Until posts are grouped by subject, attributing the count to one entity risks combining unrelated conversations.
For an editor or analyst, the first check is therefore entity resolution, followed by timing. Inspect the posts that first cluster around the latest observation and look for a concrete anchor: a primary announcement, a named release, a correction, a debate, or a repeated technical term. None of those explanations is confirmed here. They are verification targets, not claims about what happened.
A practical distinction is between a story-driven burst and a measurement-driven jump. A verified announcement at the relevant time, followed by substantive responses, would support an event explanation. If the count instead tracks a collection boundary, repeated material, or activity from a small number of accounts, the same measured rate could have a very different meaning. The stored record does not establish which explanation applies.
Why it matters
Even without a confirmed cause, the measurement is useful for triage. Technology editors can prioritize checking the label; communications and product teams can test whether the conversation concerns their organization; researchers can preserve the observation as a candidate burst for later comparison. They should not infer impact from volume alone.
Ambiguity creates an additional risk. A mistaken match to a product launch could misdirect a response, while a mistaken match to a controversy could distort a narrative. Reliable interpretation requires a stable subject, a traceable event, and evidence that discussion extends beyond repeated copying. The signal supports the first step—look more closely—but not the final step—declare why it matters.
What to watch next
- Fresh observations: Record the next snapshot with its own timestamp and an explicit measurement window. A comparable measured rate across several later windows would support persistence; a sharp retreat would suggest the initial reading was more temporary. Neither outcome is established now.
- Same-subject grouping: Review the underlying posts and separate specific uses of “Flip” from the generic verb. Record recurring named entities, links, and technical terms where available. A coherent subject is necessary before connecting the activity to a particular story.
- Primary-source timing: Look for a dated announcement or independently reported event near the start of the increase. Check the publisher and publication time against the post timestamps before proposing a causal link. Sharing a related keyword is not enough.
- Conversation depth: Track whether later posts add explanations, questions, criticism, or first-hand reports rather than repeating one item. Broader participation would support a developing conversation. Narrow repetition would warrant checks for duplication or distribution effects, without proving either.
- Concentration: Where the data permits, check how many distinct accounts contribute and whether a small group drives most of the volume. The stored 1411-post snapshot cannot answer that question, and a post count must not be presented as a person count.
Compare like with like: measured rates against measured rates over consistently defined windows, and snapshot volumes at equivalent checkpoints. Do not compare 1825.4 posts/hour directly with 1411 posts as though they were the same kind of observation.
Methodology and limitations
This briefing uses the stored observation at 2026-09-24T13:56:31Z, the reported change rate of 1825.4 posts/hour over 915 seconds, the two observations behind that rate, and the latest snapshot volume of 1411 posts. The measured rate characterizes recorded change during its window; it is not a live estimate, forecast, reach figure, engagement measure, or unique-person count.
No public event explanation has been verified for this briefing, so the increase is not attributed to a named company, product, person, or incident. The label and category are also insufficient to determine which posts concern the same subject. Coverage, collection cadence, duplication, and account-level participation are not described. The signal can identify a change worth checking, but cannot by itself establish cause, duration, sentiment, audience scale, or broader technological significance.
Track This Topic for New Signals
Set alerts for future velocity or sentiment changes around this topic.
Explore Tracking PlansAbout TrendsAGI research
TrendsAGI's automated research pipeline publishes dated signal snapshots, methodology notes, and practical workflows for teams evaluating cultural momentum. Read how signals are scoped, scored, and limited in our research methodology.


