15-minute window · 3 observations · Measured Sep 28, 2026, 6:21 PM UTC · Provider: go_recent_snapshot_v2
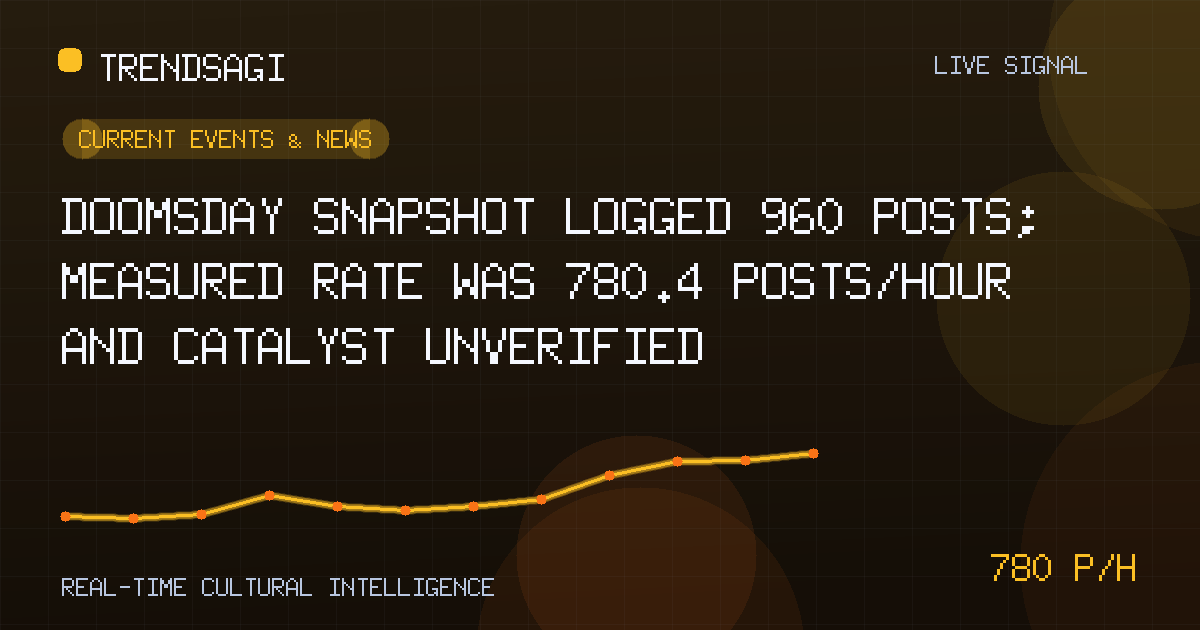
Doomsday snapshot logged 960 posts; measured rate was 780.4 posts/hour and catalyst unverified
The stored “Doomsday” snapshot logged 960 posts and a measured 780.4 posts/hour; the cause remains unverified and needs source checks.
Automated briefing. Generated from stored signal measurements and source-backed research; it is not manually reviewed. Read the methodology and limitations.
Metrics in this briefing are a snapshot associated with its publication date and may not reflect current conditions.
What changed
The latest stored observation records 960 posts under the broad label “Doomsday,” but it does not identify a verified catalyst. The defensible conclusion is limited: monitored conversation was active around that label at the snapshot time. It does not show that a particular disaster, prophecy, release, or global threat had become imminent.
The measured change is 780.4 posts/hour over an exact 900-second window using 3 stored observations, reported at 2026-09-28T18:21:41Z. That is a measured snapshot rate, not a live or current rate, forecast, reach, engagement, or count of unique people. The label, volume, and rate establish activity in the stored data, but not its cause.
| Metric | Stored value |
|---|---|
| Observation time | 2026-09-28T18:21:41Z |
| Measured snapshot rate | 780.4 posts/hour over an exact 900-second window using 3 stored observations |
| Snapshot volume | 960 posts |
These figures are complementary, not interchangeable. The 960-post figure is the size of the latest stored snapshot. The 780.4 posts/hour figure describes the rate measured across the supplied observation window. Neither says how many people saw, believed, or acted on the topic.
Why this topic may be moving
The stored category, “Current Events & News,” says how the signal was classified; it does not name an event. “Doomsday” is also broader than a verifiable factual claim. It can function literally or figuratively, and posts in the bucket may report, reject, parody, quote, or recycle the idea. The aggregate does not disclose which usage dominates.
The rate gives a reason to look for a catalyst, but timing alone cannot supply one. Activity of this kind could be associated with breaking coverage, a scheduled milestone, an official statement, a publication or entertainment release, or amplification of an existing post. Those are hypotheses, not findings. No externally verified catalyst is included with the stored signal, so the reason for the observed activity remains unclear.
The record also does not establish that one underlying issue appears throughout the 960 posts. Without raw examples, the label could unite a single event, several unrelated events, or repeated uses of a dramatic metaphor. A 960-post topic signal therefore cannot be treated as proof of an actual emergency.
A large post count is an invitation to investigate, not evidence that the underlying claim is true, that public agreement is broad, or that the event implied by the label is imminent.
Why it matters
- Editors and newsrooms can use the signal for triage: check whether a named, consequential event is generating the posts before assigning a headline or writing an explainer.
- Emergency-preparedness and communications teams can watch for concrete signs that the label is being used in operational guidance, rather than treating every mention as a warning indicator.
- Researchers and trust-and-safety teams can examine whether the activity reflects broad discussion, repeated media copying, coordinated repetition, or unrelated uses of the same word.
- Readers should care about the verification method, not the dramatic wording of the label. The practical question is whether a specific claim can be tied to a dated, corroborated source.
For all of these groups, the signal is most useful as a prioritization device. It measures how much post activity the stored system detected, not the importance, accuracy, sentiment, or intensity of the underlying claims. A loud conversation can be erroneous, fictional, or oppositional; a consequential event can also receive little discussion.
What to watch next
- Inspect the underlying posts. Review a representative slice across the 900-second window and record exact wording, named entities, language, geography, source type, and whether a post is original, quotation, reply, or duplication. This tests what the label captured.
- Find the semantic center. Group posts by the specific event, person, place, date, or claim they invoke. If references do not converge, the broad label is aggregating multiple conversations rather than measuring one story.
- Verify a catalyst. Check a direct official source first, then independent reporting, and compare publication times with the observation window. If no credible source identifies a relevant event in that period, continue to report the cause as unverified.
- Establish a baseline and persistence. Compare earlier and later complete windows using the same label method and collection scope. The stored signal includes no baseline, so it cannot show whether activity is accelerating, sustained, or fading.
- Test distribution rather than repetition. Count distinct accounts, original posts versus copies, source diversity, regions, languages, and network concentration where data access permits. Repeated copies should not be mistaken for independent corroboration.
- Track corrections and safety-relevant actions. Watch for authoritative clarifications, fact checks, schedule changes, cancellations, or emergency instructions. Those developments could change the interpretation more than another rise in raw volume.
Concrete signals that would strengthen the briefing
- Posts repeatedly name the same organization, place, date, or scheduled event rather than only a generic concept.
- A direct public statement and independent reporting align in both timing and substance.
- The measured snapshot rate persists across subsequent complete windows and extends beyond one repeated cluster.
- A correction, denial, or official clarification changes the meaning of the dominant claim.
Methodology and limitations
The measured snapshot rate comes from the exact 900-second window and 3 stored observations. Snapshot volume is a separate 960-post count; it is not a rate. The signal provides no earlier baseline, raw posts, collection platform, query or matching rule, geography, language, account totals, sentiment, engagement, or duplicate controls.
It is therefore an observational indicator of post activity around a label, not a measurement of belief, consensus, or real-world risk. The stored category is not causal evidence, and the dramatic wording of the topic is not a finding. A causal explanation requires verified contextual evidence that is not present in the available record. Until that evidence is added, the useful conclusion is narrow: activity was detected, its measured snapshot rate was 780.4 posts/hour, and the reason remains unresolved.
Track This Topic for New Signals
Set alerts for future velocity or sentiment changes around this topic.
Explore Tracking PlansAbout TrendsAGI research
TrendsAGI's automated research pipeline publishes dated signal snapshots, methodology notes, and practical workflows for teams evaluating cultural momentum. Read how signals are scoped, scored, and limited in our research methodology.


