910-second window · 3 observations · Measured Sep 2, 2026, 11:22 AM UTC · Provider: go_recent_snapshot_v2
Data Centers Signal Spikes to 308.5 Posts/Hour in 15-Minute Window
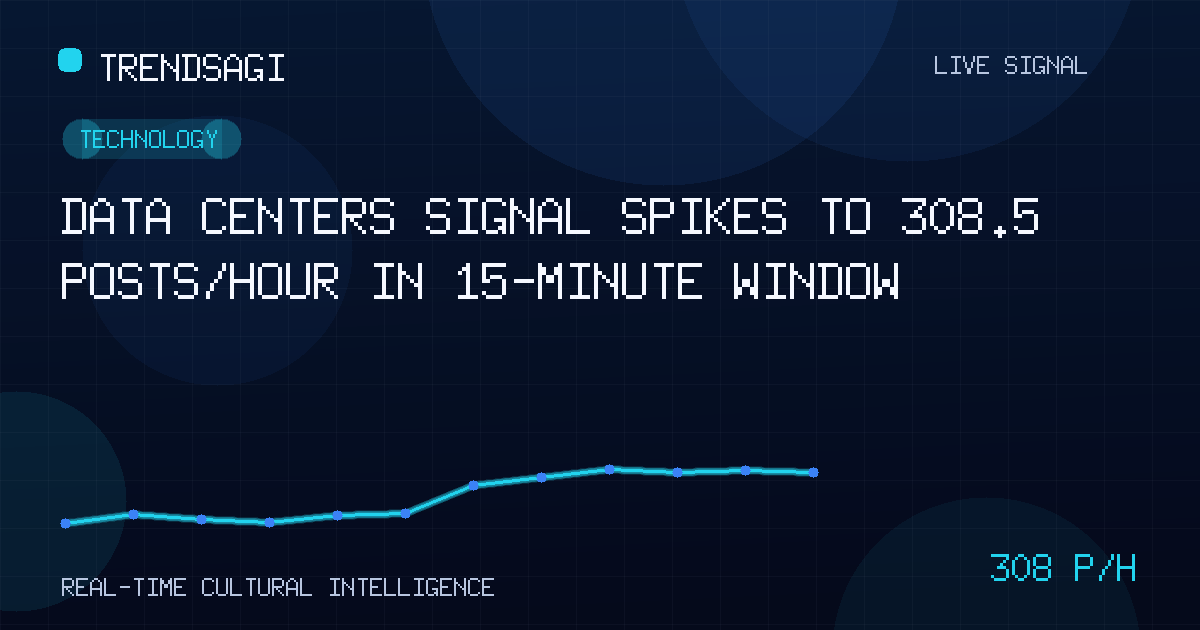
Data Centers signal hit 308.5 posts/hour in a 15-min window (545 posts at 2026-09-02T11:22:30Z). Cause unverified; briefing explains what the spike can and
Automated briefing. Generated from stored signal measurements and source-backed research; it is not manually reviewed. Read the methodology and limitations.
Metrics in this briefing are a snapshot associated with its publication date and may not reflect current conditions.
What changed
A stored signal labeled "Data Centers" recorded a measured snapshot rate of 308.5 posts per hour across a 910-second (approximately 15-minute) observation window ending at 2026-09-02T11:22:30Z. The latest snapshot volume stood at 545 posts. This rate reflects three stored observations within that short window and does not represent a live, sustained, or forecasted posting velocity.
| Observation time (UTC) | 2026-09-02T11:22:30Z |
|---|---|
| Measured posts/hour (snapshot rate) | 308.5 |
| Snapshot volume | 545 posts |
Why this topic may be moving
The spike in measured posting activity could stem from several categories of events common to the data-center sector. Quarterly earnings releases from major operators such as Equinix, Digital Realty, or hyperscalers like AWS, Microsoft Azure, and Google Cloud often trigger bursts of analyst commentary, press coverage, and social discussion. Regulatory filings—particularly Form 8-K disclosures of new lease agreements, capacity expansions, or power-procurement deals—can also concentrate conversation into narrow time windows. Infrastructure incidents, such as cooling failures, power outages, or fiber cuts at large campuses, generate immediate incident-reporting traffic. Finally, policy announcements—such as new energy-efficiency mandates, water-usage restrictions, or permitting reforms in key markets like Northern Virginia, Silicon Valley, or the Phoenix metro area—tend to produce coordinated media and stakeholder responses.
Without a verified external trigger retrieved at press time, the measured rate alone cannot distinguish between a single high-impact event and a coincident cluster of smaller items.
Because the stored signal description is empty and no verified public context was retrieved to confirm a specific catalyst, the precise cause remains unclear. Readers should treat the elevated rate as a prompt to check primary sources rather than as evidence of a confirmed development.
Why it matters
Data-center capacity, power procurement, and sustainability metrics directly affect cloud pricing, enterprise IT planning, and regional economic development. A sudden, concentrated burst of public posts often precedes or accompanies material disclosures that influence:
- Investment decisions – REIT valuations, infrastructure-fund allocations, and private-equity deal flow respond to capacity-addition signals.
- Procurement timelines – Enterprise buyers tracking colocation availability or hyperscale reserved-instance supply use chatter volume as an early indicator of tightening or loosening markets.
- Policy engagement – Utilities, regulators, and local governments monitor discussion volume to gauge community sentiment ahead of permitting hearings or rate-case proceedings.
- Sustainability reporting – Scope 2 and 3 emissions tracking for corporate buyers depends on transparent operator disclosures that often surface first in specialist forums and trade press.
For operators, a 308.5 posts/hour snapshot rate—while brief—suggests the topic achieved momentary prominence above baseline sector chatter. That prominence can amplify both accurate information and unverified rumors, affecting stakeholder perception in real time.
What to watch next
To determine whether the spike reflects a material event or transient noise, monitor these concrete signals over the next 24–48 hours:
- SEC EDGAR and SEDAR+ filings – Filter for 8-K, 10-Q, 6-K, and equivalent documents from Equinix (EQIX), Digital Realty (DLR), CoreSite, CyrusOne, Iron Mountain (IRM), and major hyperscalers.
- Utility commission dockets – Check PJM, CAISO, ERCOT, and Dominion Energy filings for new large-load interconnection requests or demand-response program changes.
- Trade-press wires – Data Center Dynamics, DCD, The Register, and Data Center Knowledge often publish within minutes of confirmed outages, lease signings, or policy shifts.
- Permitting databases – Loudoun County (VA), Santa Clara County (CA), Maricopa County (AZ), and Prince William County (VA) building-permit portals reveal ground-breaking or expansion milestones.
- Power-purchase agreement (PPA) announcements – Track renewable-energy buyer aggregators (LevelTen, REsurety) and developer press releases for new solar/wind/battery contracts tied to data-center loads.
If no primary-source confirmation emerges within two business days, the spike is likely attributable to algorithmic amplification of existing content, a coordinated marketing push, or a non-material social-media trend.
Methodology and limitations
The measured snapshot rate of 308.5 posts/hour derives from exactly three stored observations spanning a 910-second window ending at the timestamp above. This is a discrete, historical measurement—not a live rate, forecast, reach metric, engagement score, or unique-author count. The snapshot volume of 545 posts represents the cumulative count at the observation endpoint. The stored category "Other" and empty signal description limit contextual inference. No external verification of causation was obtained; the "Why this topic may be moving" section outlines plausible sector-typical drivers only. Treat all figures as untrusted until independently confirmed via primary sources.
Track This Topic for New Signals
Set alerts for future velocity or sentiment changes around this topic.
Explore Tracking PlansAbout TrendsAGI research
TrendsAGI's automated research pipeline publishes dated signal snapshots, methodology notes, and practical workflows for teams evaluating cultural momentum. Read how signals are scoped, scored, and limited in our research methodology.


