887-second window · 3 observations · Measured Sep 24, 2026, 2:26 AM UTC · Provider: go_recent_snapshot_v2
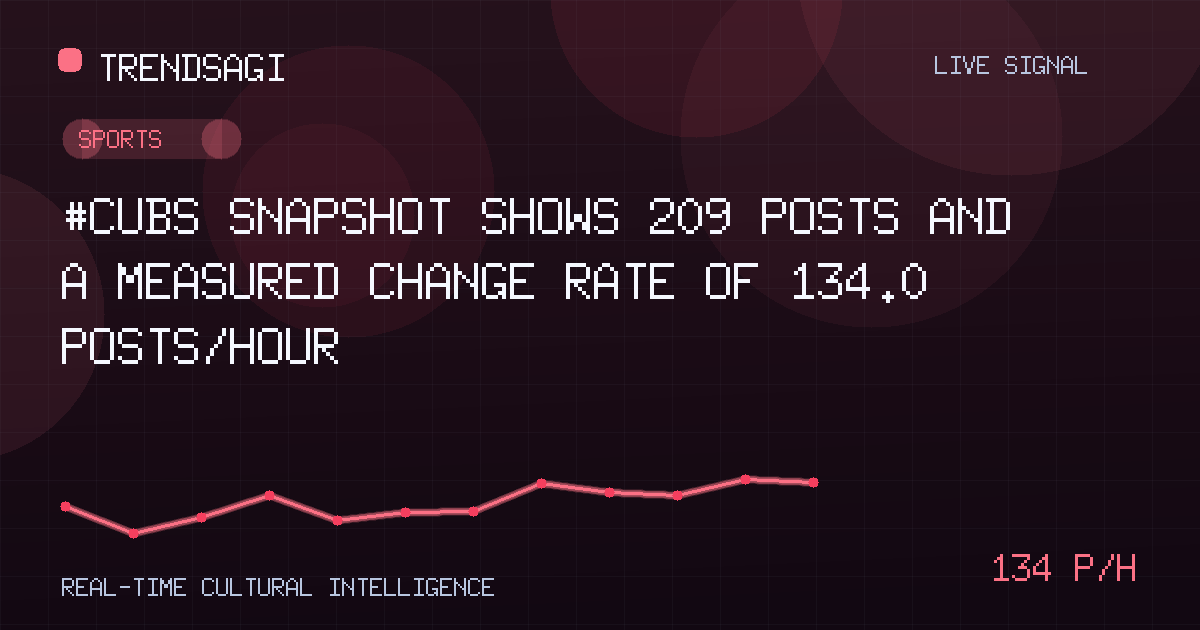
#Cubs snapshot shows 209 posts and a measured change rate of 134.0 posts/hour
The #Cubs snapshot recorded 209 posts and a measured 134.0 posts/hour rate; use the change as a cue to verify its cause.
Automated briefing. Generated from stored signal measurements and source-backed research; it is not manually reviewed. Read the methodology and limitations.
Metrics in this briefing are a snapshot associated with its publication date and may not reflect current conditions.
What changed
The stored signal records increased posting around “#Cubs,” but it does not establish what triggered the change. The latest stored snapshot contained 209 posts at 2026-09-24T02:26:26Z. Its measured snapshot change rate was 134.0 posts/hour.
The posts/hour figure was measured over an exact 887-second window using 3 stored observations, with the rate reported at 2026-09-24T02:26:26Z. It is a measured snapshot rate, not a live or current rate, a forecast, or a measure of reach, engagement, or unique people.
| Metric | Value |
|---|---|
| Observation time | 2026-09-24T02:26:26Z |
| Measured snapshot change rate | 134.0 posts/hour |
| Snapshot volume | 209 posts |
Why this topic may be moving
The available record contains no verified public context tying this burst to a particular game, result, roster move, or club announcement. The Sports category and the “#Cubs” label do not establish which organization, event, or person is responsible. Naming any of those as the cause would go beyond the evidence.
Those possibilities can guide verification, but they are not findings. The defensible conclusion is limited to an observed change in posting around the tag. A cause would need a verified, time-aligned public development; a volume change cannot supply that evidence on its own. Even identifying the club would not identify the trigger.
A label-level burst may combine several streams: official updates, event-related reactions, and unrelated uses of the tag. Separating those streams matters because an external report may explain only part of the activity. The stored figures cannot show that mix.
A measured change in posting is a reason to verify the context, not proof of what caused it.
Why it matters
For an editor or newsroom, the signal is a verification trigger: check the public record before attaching an explanation to the activity. For a community or communications team, it can prompt a review of the conversation, but only after confirming the subject and participants. For an analyst, it provides a compact measure of activity within the observed window, not a benchmark for usual volume or audience size.
Counts and rates answer different questions. The snapshot volume tells how many posts were captured at that observation; the measured rate tells how posting changed within the defined window. Neither establishes importance, credibility, sentiment, or persistence.
Without a broader baseline, there is no evidence here that the change is unusually large. The record also cannot show who posted, whether messages were duplicated, how many people took part, or whether discussion continued after the snapshot. Treat it as a monitoring signal, not proof of impact.
The practical value is prioritization, not attribution. The tag warrants a check against public reporting, but the snapshot does not justify a causal headline or an impact estimate. Verification can establish a plausible trigger; it still will not, by itself, establish audience size or independent participation.
What to watch next
A useful follow-up should turn the raw activity change into a documented sequence without presuming its cause.
- Identify the referent. Review verified public reporting and a sample of posts around the snapshot to establish whether “#Cubs” refers to a club, a competition, a person, or mixed usage. The category alone is not enough.
- Align timestamps. Compare post times with confirmed event reports, results, official announcements, and publication times. A close match can support an explanation, but sequence and plausibility still matter; overlap alone is not causation.
- Check independent participation. Look for original contributions from distinct accounts, and flag copied or syndicated wording. Repeated content can raise the post count without demonstrating independent discussion.
- Collect comparable snapshots. Keep the same tag, counting boundary, and collection method in later observations. Continued activity would suggest ongoing attention, while a reversal would indicate that the change was brief at the observed time. Neither outcome is established here.
- Triangulate the explanation. Prefer timestamped statements from the relevant organization, competition, or publisher, and distinguish those facts from users’ predictions. An unverified rumor is a lead to check, not a confirmed catalyst.
- Measure the right response. If deeper review is warranted, assess original participation and sentiment rather than treating post volume as reach or approval.
- Keep an evidence log. For each new snapshot, preserve the observation time, tag definition, counting method, and any collection gap. For each proposed cause, record the publisher, publication time, and specific claim it supports. This makes later interpretation auditable rather than anecdotal.
Methodology and limitations
The 134.0 posts/hour figure is a measured snapshot rate over the supplied 887-second window, based on 3 stored observations and reported at 2026-09-24T02:26:26Z. The 209 posts are a separate snapshot volume, not a rate, a reach estimate, or a unique-person count.
The snapshot is bounded by its observation time. It does not establish total discussion size, normal-period significance, sentiment, geography, or continuation after that moment. The available record also lacks post-level timestamps, account information, and verified event context, so no causal narrative can be responsibly assigned.
For future checks, preserve the counting method and collection gaps, log verified developments with their publication times, and compare like-for-like observations. That would help distinguish a short event-driven burst from a sustained shift without overstating what this snapshot shows.
Track This Topic for New Signals
Set alerts for future velocity or sentiment changes around this topic.
Explore Tracking PlansAbout TrendsAGI research
TrendsAGI's automated research pipeline publishes dated signal snapshots, methodology notes, and practical workflows for teams evaluating cultural momentum. Read how signals are scoped, scored, and limited in our research methodology.