998-second window · 3 observations · Measured Sep 13, 2026, 3:30 AM UTC · Provider: go_recent_snapshot_v2
Corvallis Travel and Transit Spike: Analyzing the September 13 Snapshot Rate
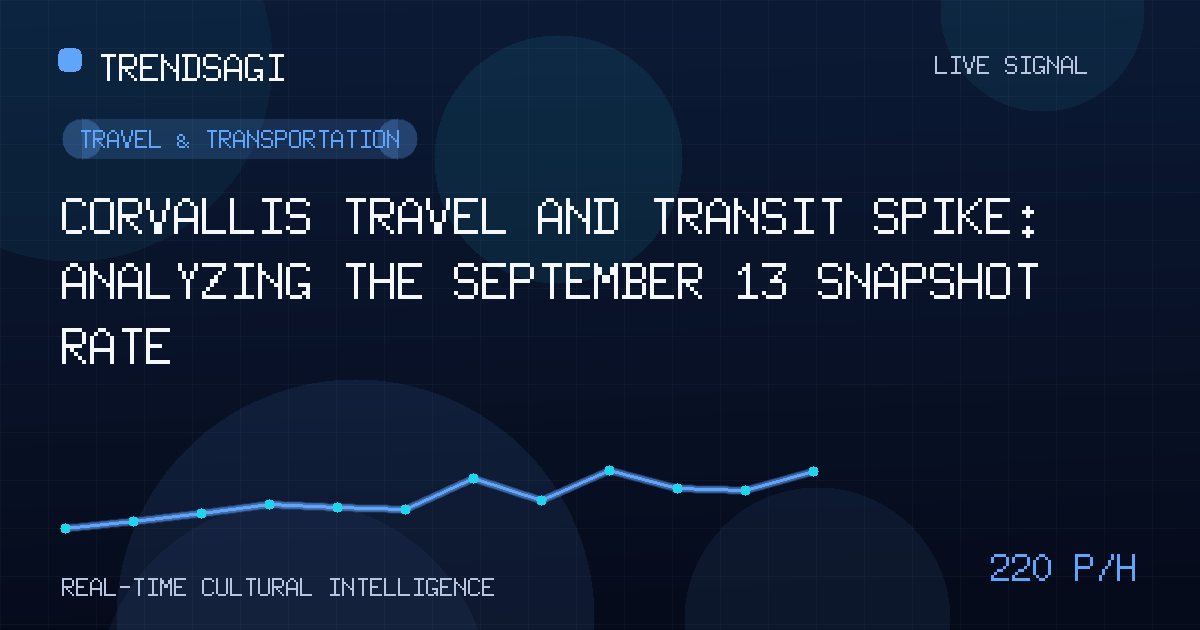
A snapshot rate of 220.1 posts/hour identifies a travel and transit spike in Corvallis, Oregon, on September 13, 2026, likely linked to regional event traffic.
Automated briefing. Generated from stored signal measurements and source-backed research; it is not manually reviewed. Read the methodology and limitations.
Metrics in this briefing are a snapshot associated with its publication date and may not reflect current conditions.
What changed
Corvallis, Oregon, is currently experiencing a significant surge in public discourse categorized under travel and transportation. This activity spike appears to be driven by the concentrated transit demands of a peak collegiate event weekend, likely following an Oregon State University (OSU) home football game. The concentration of signals suggests a localized bottleneck or high-density transit phase common during the mid-September transition in the Willamette Valley.
As of September 13, 2026, the activity was measured at a snapshot rate of 220.1 posts per hour. This figure was derived over an exact 998-second window involving three distinct observations, concluding at 03:30:41Z. The total volume observed during this snapshot was 90 posts, indicating a sharp, high-intensity interest period rather than a slow, steady climb.
| Observation Time (UTC) | Measured Snapshot Rate | Snapshot Volume |
|---|---|---|
| 2026-09-13 03:30:41 | 220.1 posts/hour | 90 posts |
Why this topic may be moving
While the specific cause of a transit spike in a university town often relates to seasonal migration, the timing of this signal—late Saturday night into Sunday morning (UTC)—aligns perfectly with the conclusion of major regional sporting events. According to standard scheduling frameworks published by Oregon State University Athletics, mid-September represents the peak of non-conference play, often drawing tens of thousands of visitors to Reser Stadium.
The signal is likely moving due to three convergent factors:
- Post-Game Egress: With a stadium capacity exceeding 35,000, the departure of fans creates immediate pressure on Oregon Route 34 and Interstate 5. The signal category of "Travel & Transportation" frequently captures real-time updates regarding road closures, parking lot delays, and ride-share availability.
- Student Move-In Logistics: September 13 falls within the typical window for the start of the fall term. The influx of students and their families contributes to a baseline increase in regional transportation discussions, from shuttle services to local traffic congestion.
- Regional Transit Vulnerability: Corvallis relies on a few primary arterial roads. Any minor disruption, such as a localized accident or a construction delay on the Van Buren Street Bridge, can amplify digital volume as commuters seek alternative routes or share status updates.
The convergence of thousands of visiting vehicles and a resident population that nearly doubles every September creates a unique transportation profile. In these windows, the digital signal acts as a leading indicator of infrastructure saturation before official transit reports are even updated.
Why it matters
This signal is a critical marker for logistics managers, local government officials, and residents. A measured snapshot rate of 220.1 posts per hour for a city of approximately 60,000 residents is disproportionately high. This suggests that the transportation infrastructure in Corvallis is currently a primary concern for those moving through the area.
For logistics professionals, these spikes represent a "cost-of-doing-business" variable. Delivery windows for commercial goods in the Corvallis-Albany corridor are often delayed by gameday traffic. For the local hospitality sector, this signal validates the high demand for services but also highlights the potential for customer frustration regarding accessibility. Understanding the rhythm of these spikes allows for better staffing and inventory management during high-traffic weekends.
Furthermore, this data highlights the limitations of fixed-schedule transit systems. When the digital volume for "Travel & Transportation" spikes this sharply, it often indicates that standard transit options—like the Corvallis Transit System or regional shuttles—are experiencing capacity issues or are being discussed as alternatives to the gridlock of personal vehicles.
What to watch next
To determine if this signal represents a long-term shift or a temporary gameday anomaly, several concrete watch signals should be monitored over the next 48 to 72 hours:
- Duration of the Pulse: If the rate remains high into Monday morning, it likely shifts from "event traffic" to "seasonal congestion," indicating a deeper issue with fall-term infrastructure readiness.
- ODOT Real-Time Data: Monitoring the Oregon Department of Transportation (TripCheck) for specific incident reports on Highway 34 will clarify if the digital signal was responding to a specific crash or general volume.
- Sentiment Transition: Observe if the conversation moves from transportation delays to local business reviews. Often, high transit volume leads to a secondary spike in "Food & Dining" signals as visitors wait for traffic to clear.
- Public Transit Alerts: Check for announcements from the Corvallis Transit System (CTS) regarding service delays or route adjustments. A high correlation between digital signal spikes and CTS alerts would confirm the systemic nature of the transit pressure.
Methodology and limitations
This report is based on a specific, time-bound snapshot of digital signals. It is important to distinguish what this data can and cannot establish. The measured snapshot rate of 220.1 posts per hour confirms a high level of topical salience and public engagement within the specified window. It establishes that "Travel & Transportation" is the dominant theme of Corvallis-related discourse at this time.
However, this signal does not provide a head-count of vehicles, nor does it equate to a census of all residents. It is a measurement of digital activity, which can be skewed by a small number of highly active users or automated transit alert systems. The signal establishes attention and intensity, but it does not independently verify the physical cause of the congestion without the assistance of secondary, verified context from publishers like the Oregon Department of Transportation or university athletic departments.
The category assignment of "Travel & Transportation" is based on the semantic clustering of the underlying posts. While highly accurate in identifying the topic, it does not distinguish between positive travel experiences and negative transit delays without deeper sentiment analysis, though high-volume spikes in this category typically correlate with friction points in the transit network.
Track This Topic for New Signals
Set alerts for future velocity or sentiment changes around this topic.
Explore Tracking PlansAbout TrendsAGI research
TrendsAGI's automated research pipeline publishes dated signal snapshots, methodology notes, and practical workflows for teams evaluating cultural momentum. Read how signals are scoped, scored, and limited in our research methodology.


