1796-second window · 3 observations · Measured Oct 3, 2026, 2:26 PM UTC · Provider: go_recent_snapshot_v2
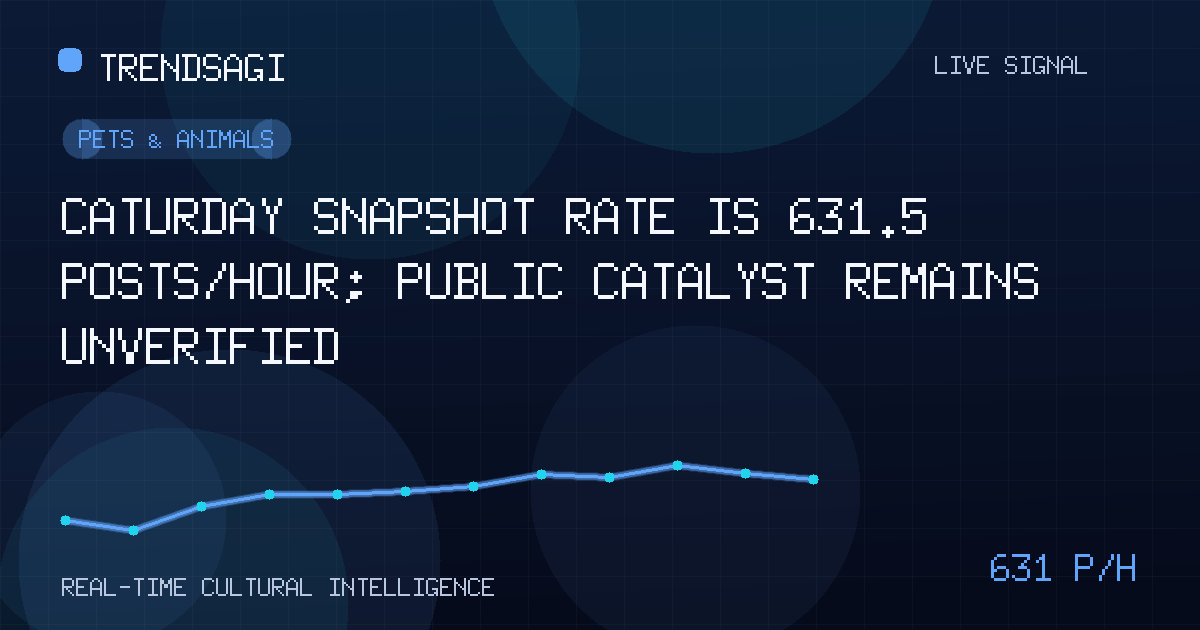
Caturday snapshot rate is 631.5 posts/hour; public catalyst remains unverified
Caturday shows a measured 631.5 posts/hour snapshot rate and 765 posts; this briefing separates the rise from an unverified cause and identifies next checks.
Automated briefing. Generated from stored signal measurements and source-backed research; it is not manually reviewed. Read the methodology and limitations.
Metrics in this briefing are a snapshot associated with its publication date and may not reflect current conditions.
What changed
Caturday registered a short-window rise in the monitored feed. At 2026-10-03T14:26:22Z, the latest snapshot contained 765 posts, and the measured snapshot rate was 631.5 posts/hour over an exact 1796-second window using 3 stored observations.
This is enough to trigger closer monitoring, but not enough to explain the movement. No specific public catalyst was verified for this snapshot. The 631.5 posts/hour figure is a measured snapshot rate, not a live or current rate, forecast, reach, engagement measure, or unique-person count. The 765 figure is snapshot volume, not a rate; the two values should not be added, substituted for one another, or treated as equivalent measures of attention.
| Observation time | 2026-10-03T14:26:22Z |
|---|---|
| Measured snapshot rate | 631.5 posts/hour |
| Measurement window | Exact 1796-second window using 3 stored observations |
| Latest snapshot volume | 765 posts |
Why this topic may be moving
The cause remains unclear. The signal does not include source posts, linked announcements, event references, or publisher evidence connecting the rise to a specific news story, campaign, meme, or platform event. With no verified external catalyst, a confident causal attribution would go beyond the evidence.
Several mechanisms could still be tested:
- Habit or timing: the label may collect posts that routinely appear around the same part of the week, although the signal does not establish that pattern.
- A breakout post: one image, video, or joke could have prompted imitation and reposting.
- Distribution effects: recommendation systems, account networks, or cross-posting could have concentrated visibility.
- Labeling noise: loosely applied tags or reused media could make distinct activity look like one coherent trend.
These are hypotheses, not findings. They may overlap, and the available numbers cannot distinguish among them.
The firm conclusion is that the monitored label showed increased activity within the stated window; the source, meaning, and durability of that increase still require evidence.
What the signal can and cannot establish
The signal is useful for timing and triage. It establishes when the observation was made, the measured snapshot rate during the exact window, and the volume visible at the endpoint. That makes Caturday a topic to inspect promptly rather than a trend whose cause is already known.
It does not establish:
- how many unique accounts or people were active;
- whether posts were original, duplicated, automated, or spam;
- whether anyone saw, clicked, shared, or responded to them;
- which platforms, regions, or communities supplied the posts;
- whether the activity represented broad interest or a narrow burst; or
- whether the pace persisted after the observed window.
The Pets & Animals classification makes the signal relevant to that editorial beat, but it does not prove that every post was specifically about cats. The label alone also does not reveal whether the activity consisted of pet photos, memes, greetings, or mixed content.
Why it matters
Pet publishers and social editors should inspect the actual posts before choosing coverage. A rising posting rate can signal an emerging conversation, a reusable media format, or a tagging anomaly. Each possibility calls for a different response: reporting, monitoring, audience engagement, or a taxonomy fix. The safest immediate step is to sample recent and high-visibility items and look for a shared source or message.
Trend analysts and community managers also need the distinction between volume and momentum. Snapshot volume describes the latest observed count, while the measured snapshot rate describes change during a defined window. Neither alone establishes audience size or influence. Treating 765 posts as evidence of 765 participants, or 631.5 posts/hour as a forecast, would overstate what the signal knows.
What to watch next
The next useful evidence should establish whether this was a durable shift or a short burst:
- Persistence: compare subsequent observations using the same exact window. A rate that remains elevated supports an ongoing pattern; a rapid fall suggests a temporary spike.
- Source concentration: determine whether posts come from many independent accounts or a small set repeatedly recycling the same media. Concentration would weaken the case for broad organic interest.
- Sequence: find the earliest identifiable post and check whether later items reference, copy, or react to it. A clear source followed by a cluster is stronger evidence of a shared catalyst than simultaneous unrelated posts.
- Content consistency: review captions, links, and media to separate genuine Caturday participation from broad pet content, unrelated uses of the word, or duplicate uploads.
- Relative movement: compare the label with the wider Pets & Animals category and adjacent cat-related labels. A rise confined to one label may reflect classification or collection effects rather than a category-wide shift.
- Public verification: use Google Search to look for timestamped publisher reports or public posts that precede the cluster. A credible source connected in time and content would justify naming a catalyst; uncorrelated results should not be used to manufacture one.
Concrete confirmation would be a sustained rate, participation across unrelated accounts, identifiable original media, consistent content, and independent public corroboration. If those signals fail to appear, the event should remain described as an unexplained short-window increase.
Methodology and limitations
The 631.5 posts/hour value is a measured snapshot rate based on 3 stored observations across an exact 1796-second window. It describes only that measured interval and should not be presented as a live rate, projection, or measure of reach. The 765 posts are the volume in the latest snapshot, a separate endpoint measure.
A short series of observations can reveal where to investigate, but it cannot establish normal baselines, duration, or statistical significance. No post-level sample, historical comparison, engagement data, or verified causal source was available in the record, so this briefing does not infer an event, audience effect, or sustained trend from the rate alone.
Track This Topic for New Signals
Set alerts for future velocity or sentiment changes around this topic.
Explore Tracking PlansAbout TrendsAGI research
TrendsAGI's automated research pipeline publishes dated signal snapshots, methodology notes, and practical workflows for teams evaluating cultural momentum. Read how signals are scoped, scored, and limited in our research methodology.


