1950-second window · 2 observations · Measured Oct 9, 2026, 1:11 AM UTC · Provider: go_recent_snapshot_v2
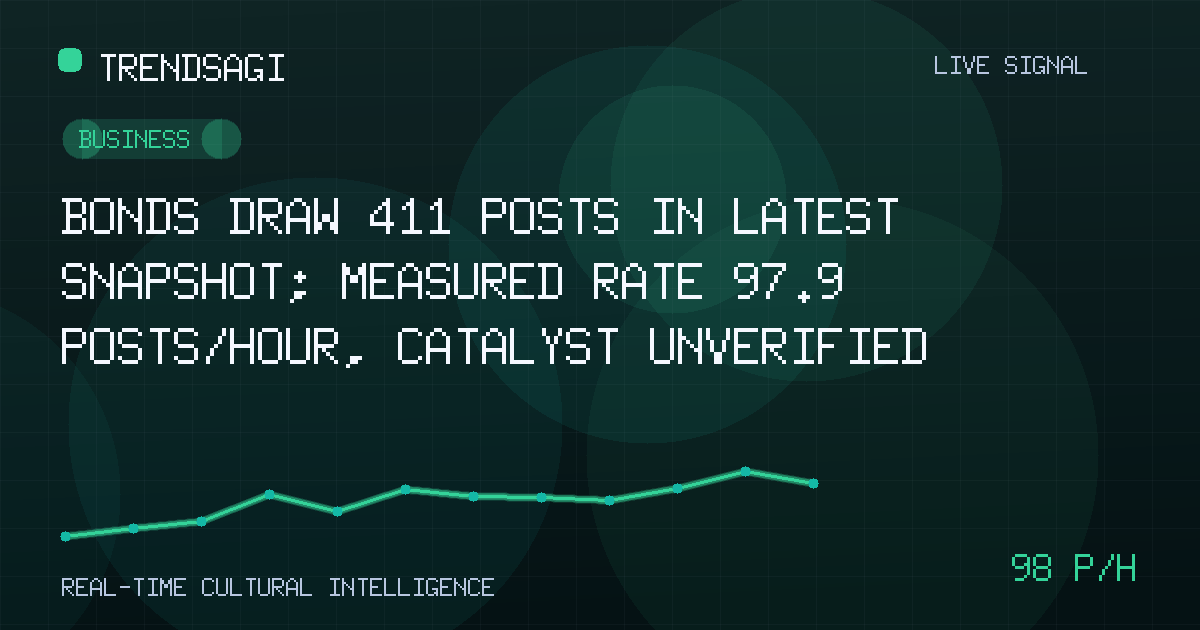
Bonds draw 411 posts in latest snapshot; measured rate 97.9 posts/hour, catalyst unverified
Bonds drew 411 posts in the latest snapshot; at 97.9 measured posts/hour, the unverified trend needs primary-source checks.
Automated briefing. Generated from stored signal measurements and source-backed research; it is not manually reviewed. Read the methodology and limitations.
Metrics in this briefing are a snapshot associated with its publication date and may not reflect current conditions.
What changed
Bonds are drawing a concentrated burst of conversation, but no specific catalyst has been verified. The defensible read is an attention alert—not evidence that bond prices, yields, credit conditions, or issuance expectations have moved.
The latest snapshot, observed at 2026-10-09T01:11:50Z, contained 411 posts. The stored comparison produced a measured snapshot rate of 97.9 posts/hour across an exact 1950-second window using two stored observations.
| Observation time | Measured posts/hour | Latest snapshot volume |
|---|---|---|
| 2026-10-09T01:11:50Z | 97.9 posts/hour | 411 posts |
This makes the topic worth investigating, but the volume alone does not explain the story. Bonds can combine sovereign, agency, municipal, and corporate discussions, as well as posts about yields, inflation expectations, auctions, fiscal policy, or credit risk. A repeated headline can also cause many accounts to circulate the same point.
The 97.9 figure is a measured historical snapshot rate. It is not a live or current rate, a forecast, reach, engagement, or a count of unique people. Likewise, 411 is snapshot volume, not a rate.
Why this topic may be moving
The cause remains unclear because the available evidence does not establish a time-matched public report, official release, or market event behind the increase. It would be misleading to name a macroeconomic release, central-bank decision, auction, downgrade, or geopolitical event as the trigger without verification.
Several explanations merit testing:
- Macro repricing: New data or policy expectations may be changing views on rates, inflation, or the shape of the yield curve.
- Supply and demand: Announced borrowing, an auction, or concern about absorption could focus discussion on a particular bond market.
- Credit or fiscal stress: A downgrade, default concern, budget debate, or spread move could push the broad label into higher conversation.
- Company-specific news: Earnings, refinancing, restructuring, or new debt issuance may matter without changing the wider bond market.
- Attention mechanics: Repetition by influential accounts, breaking-news coverage, or platform amplification may increase post count without adding new facts.
These are investigation paths, not findings. The first verification task is to identify what kind of bond and which driver dominate the sample; only then can a catalyst be assessed.
Why it matters
For fixed-income and macro readers, a rapid social signal can be an early prompt to inspect market data. It can also be wrong, delayed, or dominated by copied commentary. The signal is useful only if it points toward a testable question: which instrument, which market, and which event?
- Portfolio and risk teams should check whether the discussion aligns with sovereign yields, corporate spreads, auction demand, volatility, or funding conditions.
- Treasury and issuer teams should separate broad bonds chatter from commentary relevant to their currency, tenor, benchmark, or refinancing calendar.
- Policy and communications teams should identify which claims are circulating, whether they are sourced, and whether a primary document exists.
- General readers should not treat post volume as market impact, investor consensus, or a directional call.
The useful question is not whether bonds are popular in conversation, but whether the burst is tied to a verified event and followed by confirming market data. Without both, it remains an attention signal—not a market signal.
What to watch next
A disciplined follow-up should move from volume to evidence in this order:
- Inspect the posts. Identify the earliest repeated claim, the assets named, and whether sources cite a document, dataset, or named event.
- Separate original reporting from reaction. Determine whether many posts add independent information or merely quote the same headline.
- Check primary sources. Consult the relevant official calendar, policy release, budget or debt announcement, auction notice, issuer filing, or rating action.
- Require market confirmation. Look for a corresponding move in the relevant yields, spreads, prices, curve, auction result, or volatility measure rather than inferring it from chatter.
- Test persistence. Gather comparable future snapshots using the same collection method. A brief cluster around an event is different from sustained discussion.
- Compare independent coverage. See whether established financial publishers connect their reporting to the same catalyst and timestamp; omit the catalyst if they do not.
Concrete watch signals
The most informative next observations would be:
- Specificity: Conversation shifts from generic bonds to named countries, issuers, tenors, auctions, or policy decisions.
- Source quality: Primary documents and attributable reporting replace unsourced claims or repeated wording.
- Market confirmation: Several relevant bond-market indicators move in a way consistent with the claimed catalyst.
- Breadth without duplication: Independent accounts and distinct arguments sustain the discussion rather than one post being recopied.
- Decay: Measured activity recedes after the event is covered, suggesting a news burst rather than a durable shift in attention.
Methodology and limitations
This briefing uses a Business-category snapshot labeled Bonds. The latest observation at 2026-10-09T01:11:50Z contains 411 posts. The 97.9 posts/hour figure is a measured snapshot rate from two stored observations over the exact 1950-second window reported at that time.
The short observation record limits interpretation. It does not provide a longer baseline, geographic or language distribution, account-quality measures, sentiment, source breakdown, or a direct connection between posts and market trading. Posts may also contain repetition, copied wording, automated activity, or reactions to older information.
No external cause is asserted because no publisher-verified, time-matched catalyst is established in the available record. Until that verification exists, the candidate explanations above should remain hypotheses, while the strongest conclusion is limited to increased conversation volume captured by the stored signal.
Track This Topic for New Signals
Set alerts for future velocity or sentiment changes around this topic.
Explore Tracking PlansAbout TrendsAGI research
TrendsAGI's automated research pipeline publishes dated signal snapshots, methodology notes, and practical workflows for teams evaluating cultural momentum. Read how signals are scoped, scored, and limited in our research methodology.


