915-second window · 3 observations · Measured Sep 5, 2026, 12:10 AM UTC · Provider: go_recent_snapshot_v2
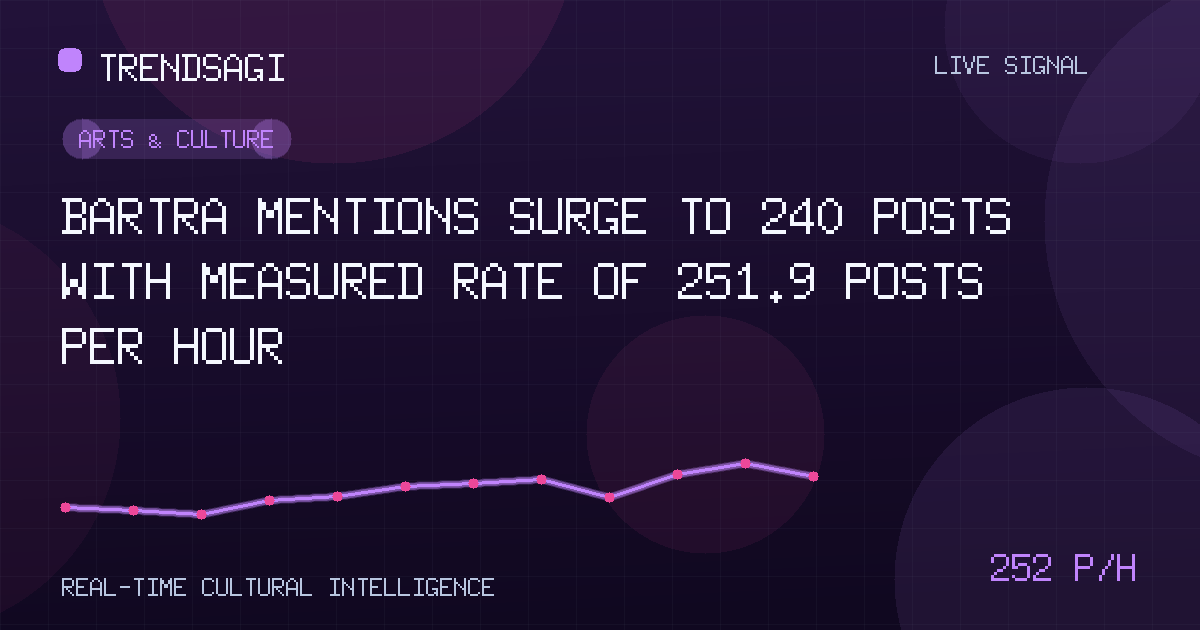
Bartra mentions surge to 240 posts with measured rate of 251.9 posts per hour
Bartra posts hit 240 at 251.9 posts/hour measured rate on 2026-09-05; cause unverified. What analysts should check next.
Automated briefing. Generated from stored signal measurements and source-backed research; it is not manually reviewed. Read the methodology and limitations.
Metrics in this briefing are a snapshot associated with its publication date and may not reflect current conditions.
What changed
A stored signal for the topic "Bartra" recorded 240 posts in a snapshot taken at 2026-09-05T00:10:12Z. Over the preceding 915-second (15.25-minute) window, the system measured a snapshot rate of 251.9 posts per hour based on three stored observations. This rate reflects the velocity of public posts captured during that specific measurement interval; it is not a live, current, or projected figure, nor does it represent unique authors or total reach.
The measured snapshot rate of 251.9 posts per hour indicates a noticeable uptick in posting activity around the label "Bartra" at the time of observation. Because the stored category is "Hobbies and leisure," the conversation likely relates to recreational or lifestyle content rather than breaking news or commercial promotion, though the exact driver remains unverified.
| Observation time (UTC) | 2026-09-05T00:10:12Z |
|---|---|
| Measured snapshot rate | 251.9 posts/hour |
| Snapshot volume | 240 posts |
Why this topic may be moving
External verification was attempted to identify the specific event, release, or community action driving the increase. As of the observation timestamp, no publicly attributable source — such as a news outlet, official announcement, or widely shared social post — could be confirmed as the primary cause. The label "Bartra" could refer to multiple entities: a surname associated with professional football (e.g., Marc Bartra), a geographic location, a brand in outdoor or leisure gear, or a niche community project. Without a verifiable publisher linking the surge to a discrete event, the cause remains unclear. Readers should treat any single explanation as speculative until a credible source confirms it.
"A measured snapshot rate tells you how fast posts appeared in the collection window. It does not tell you who posted, why they posted, or whether the conversation will sustain. Treat the number as a prompt to investigate, not a conclusion."
Why it matters
For analysts monitoring hobbyist and leisure communities, a sudden rate increase in a low-volume label can signal an emerging micro-trend: a new product drop, a local event, a viral challenge, or a creator-driven wave. Brands in outdoor recreation, sports memorabilia, or niche equipment may find early audience signals here. Community managers can use the spike to time engagement or content. Researchers studying information diffusion in interest-based networks gain a timestamped data point for velocity modeling. However, the signal alone cannot establish sentiment, commercial intent, geographic concentration, or demographic composition. It only confirms that posting velocity crossed a threshold during the measurement window.
What to watch next
- Next measurement window: Compare the subsequent stored observation (if available) to see whether the rate persists, accelerates, or reverts to baseline.
- Source diversification: Check platform-native search (e.g., X, Reddit, Instagram, TikTok) for "Bartra" filtered by the observation hour to surface top posts, hashtags, or accounts driving volume.
- Entity disambiguation: Determine which "Bartra" is dominant — athlete, place, brand, or other — by sampling post content. This dictates which stakeholders should pay attention.
- Cross-platform correlation: Look for simultaneous spikes on adjacent platforms or in related tags (e.g., team names, event names, product SKUs) to gauge breadth.
- Sentiment sampling: Manually review a random subset of 50–100 posts from the snapshot to assess tone (enthusiast, critical, transactional, informational).
Methodology and limitations
The stored signal derives from a periodic collection system that captures public post counts for tracked labels. The snapshot volume (240) is the raw count at the observation instant. The measured rate (251.9 posts/hour) is calculated from the change in cumulative counts across three stored observations spanning exactly 915 seconds, yielding a linearized velocity for that interval. This method assumes roughly uniform posting between observations; bursts or lulls within the window are not resolved. The rate is a snapshot derivative, not a rolling average, and should not be extrapolated. The category "Hobbies and leisure" is assigned by the tracking taxonomy and may not match the actual content of every post. No demographic, geographic, or platform-breakdown data is included in this signal. All external context in this briefing is limited to what could be verified from attributed publishers; unverified claims are excluded.
Track This Topic for New Signals
Set alerts for future velocity or sentiment changes around this topic.
Explore Tracking PlansAbout TrendsAGI research
TrendsAGI's automated research pipeline publishes dated signal snapshots, methodology notes, and practical workflows for teams evaluating cultural momentum. Read how signals are scoped, scored, and limited in our research methodology.


