896-second window · 3 observations · Measured Sep 30, 2026, 8:55 PM UTC · Provider: go_recent_snapshot_v2
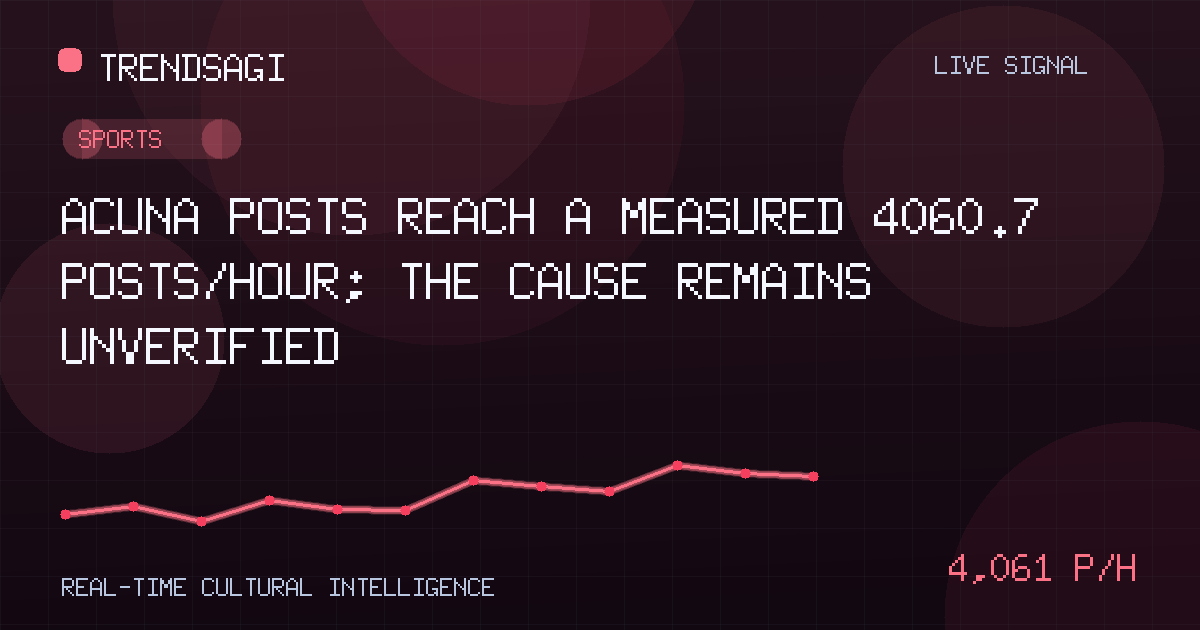
Acuna posts reach a measured 4060.7 posts/hour; the cause remains unverified
Acuna registers 4060.7 posts/hour in the latest stored window, with 1220 snapshot posts; editors get a framework for verifying the cause.
Automated briefing. Generated from stored signal measurements and source-backed research; it is not manually reviewed. Read the methodology and limitations.
Metrics in this briefing are a snapshot associated with its publication date and may not reflect current conditions.
What changed
The stored Acuna signal shows a concentrated burst of related posting: the latest snapshot contains 1220 posts, and the series records a measured snapshot rate of 4060.7 posts/hour. The supported conclusion is that activity around the label merits investigation—not that a particular event, person, or organization caused it.
The rate was measured at 2026-09-30T20:55:20Z over an exact 896-second window using 3 stored observations. It describes that historical window only. It is not a live or current rate, a forecast, total reach, engagement, or a count of unique people, and 1220 is snapshot volume rather than a rate.
| Observation time | Measured snapshot rate | Latest snapshot volume |
|---|---|---|
| 2026-09-30T20:55:20Z | 4060.7 posts/hour across an exact 896-second window using 3 stored observations | 1220 posts |
Why this topic may be moving
No verified public development is available in the supplied record to explain the movement. The stored category is “Sports,” but category metadata does not establish that the posts concern a sporting event, nor does it identify the relevant Acuna. The blank signal description provides no event, geography, language, source mix, or other context.
That leaves an important identity problem. “Acuna” may match more than one entity or spelling, and the label alone does not show what writers mean. It would be unsafe to attribute the spike to a match, player, club, organization, announcement, controversy, or accidental duplication. None of those explanations is verified by the stored evidence.
Possible causes should therefore be treated as testable hypotheses. A genuine news event, scheduled activity, official post, viral clip, coordinated amplification, automated repetition, or a change in collection or labeling could each produce a short burst. The available figures cannot distinguish among them.
High post volume is a detection signal, not an explanation. Before treating Acuna as a confirmed trend event, establish what entity people are posting about and whether a public development demonstrably coincides with the burst.
Why it matters
The immediate value is triage. A measured short-window increase can tell editors, audience researchers, communications teams, and fact-checkers where to look first. It can prioritize monitoring of an unfamiliar label and help prevent a noisy burst from being ignored. It cannot, on its own, support a causal headline or a claim that public attention has permanently shifted.
Volume and rate answer different questions. The 1220-post snapshot describes the size of the stored collection at the observation time; 4060.7 posts/hour describes change across the specified short window. Neither figure establishes how many people saw the content, how often they interacted, whether sentiment was positive or negative, or whether discussion was organic.
What the signal can establish
- Posts were assigned the Acuna label in the stored collection at the stated observation time.
- The supplied series produced a measured snapshot rate of 4060.7 posts/hour across the stated window and observations.
- The timestamp allows subsequent checks to determine whether the activity persisted after the measured interval.
What it cannot establish
- The identity of the subject, the catalyst, or whether the label is being used consistently.
- Unique authors or viewers, reach, engagement, sentiment, geography, language, or source reliability.
- Whether the movement exceeds a normal baseline, persists beyond the window, or reflects spam, duplication, or a measurement change.
What to watch next
A useful next pass should preserve the distinction between detection and explanation, using the same collection definition wherever possible.
- Resolve the entity. Inspect a representative cross-section of matched posts and group them by the person, place, team, organization, product, or other subject named in the text. Capture spelling variants only if they are actually observed; do not broaden the query silently.
- Check persistence. Compare later snapshots using the same query and collection rules. Track the measured rate separately from snapshot volume: a sustained high rate would support continued activity, while a falling rate could leave a large but static pool of captured posts.
- Audit source quality. Review whether activity is concentrated in a few accounts, repeated verbatim, dominated by reposts, or associated with automated behavior. This does not prove manipulation, but it changes how confidently the burst can be interpreted as broad interest.
- Test the catalyst. Look for a contemporaneous official statement, event record, participant post, or independently reported development. Attribute any accepted public fact to its publisher and check that its timing and entity match the Acuna label before claiming causation.
- Validate the pipeline. Compare collection settings, category assignment, matching logic, and observation timestamps with an earlier period. A taxonomy or ingestion change can create an apparent trend without any change in real-world posting.
Concrete signals that would strengthen—or weaken—the briefing
- Strengthen: repeated high measured rates in later windows; a dominant cluster tied to one clearly identified subject; diverse credible sources; and a verified public development that aligns with the observed timing.
- Weaken: a duplicated content cluster, heavy low-quality account activity, inconsistent entity use, an unchanged collection rule, or no independently verifiable catalyst.
Methodology and limitations
The figures are reproduced from the canonical record rather than recalculated. The measured rate is 4060.7 posts/hour, based on 3 stored observations across an exact 896-second window ending at 2026-09-30T20:55:20Z; the latest snapshot volume is 1220 posts. Because the full observation series, query definition, and comparison baseline are not supplied, the result cannot be labeled statistically abnormal or compared with a longer trend.
The timestamp marks the stored observation, not necessarily the date of an underlying event. “Sports” is a classification, not proof of context. No external causal fact met the verification standard for inclusion, so the reason Acuna is moving remains unclear. The safest current characterization is a measured short-window post-activity signal requiring entity, source, and persistence checks before publication as a confirmed trend.
Track This Topic for New Signals
Set alerts for future velocity or sentiment changes around this topic.
Explore Tracking PlansAbout TrendsAGI research
TrendsAGI's automated research pipeline publishes dated signal snapshots, methodology notes, and practical workflows for teams evaluating cultural momentum. Read how signals are scoped, scored, and limited in our research methodology.


